
PANG-NAV User Manual
Introduction
PANG-NAV is a tool developed by the PArthenope Navigation Group (PANG), able to process GNSS measurements in order to obtain positon solution. PANG-NAV starts from RINEX (Receiver INdependent EXchange format) files, it analyzes GPS and Galileo data and implements SPP (Single Point Positioning). Besides the user position, the tool is able to provide information about the satellite visibility and geometry.
In PANG-NAV, RAIM functionalities are included; specifically, the software is able to deal with blunders/outliers, discarding the anomalous measurements; in its output the tool provides horizontal and vertical protection levels, and information about the reliability of the solution.
In case the ground truth is known, PANG-NAV can also compute and analyze the position errors.
Usage
PANG-NAV tool has been developed in Matlab environment; in order to use the software, it is necessary to set the “PANG_NAV” folder as current directory as shown in figure 1.
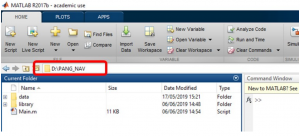 Figure 1
To run PANG-NAV, “Main.m” file should be opened and “Run” button should be pressed; alternatively, “Main” should be typed in the “Command Window”.
Settings
Before running PANG-NAV, the settings must be chosen. To this purpose, “Main.m” file should be opened and the “settings” section updated. In details, the settings to set are
- Data interval
- GNSS system
- Weighting
- RAIM
- Mask angle
- Signal to noise ratio limit
- Error analysis
- Solution source
To set the data interval, the time value in seconds between consecutive epochs must be assigned to the “dt_data” variable.To choose the GNSS system to use, a value of “1” or “2” must be assigned to “gnss_systems” variable; with a value “1”, GPS only measurements are processed, with “2” GPS/Galileo measurements are jointly processed. Other GNSS configurations (e.g. Galileo only or GPS/Glonass) are not currently supported.The SPP solution can be obtained weighting equally all the measurements (setting “mask_angle” variable equal to “0”) or according to the satellite elevation (setting “mask_angle” variable equal to “1”).RAIM functionalities are active if “RAIM_flag” is set to “1”, otherwise it is set to “0”.The mask angle is set assigning a value, in degrees, to the variable “mask_angle”.The minimum SNR (signal-to-noise ratio) is set assigning a value, in dB-Hz, to the “SNR_lim” variable.PANG-NAV tool can carry out an error analysis of the solution; to enable it, the variable “Error_Analysis_flag” should be set to “1”. If “Error_Analysis_flag” is set to “0”, no analysis is carried out.In case the analysis is enabled, the ground truth can be taken from the RINEX file if the receiver is static, setting the variable “Static_Solution_fromRINEX” to “1”.An example of the settings section in the code is reported in figure 2.
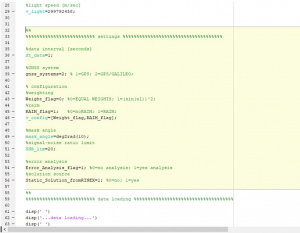 Figure 2
Moreover, the RAIM settings could be defined too. Specifically, “HAL”, “VAL”, “PMD”, “PFA” and “sigma_pr” are the possible RAIM settings.“HAL” and “VAL” are the horizontal and vertical alarm limits.“PMD”, “PFA” are the probability of missed detection and false alarm“sigma_pr” is the standard deviation of the pseudorange measurements.The just mentioned settings are used only in case the RAIM functionality is active and should be set according to the considered application.
Data importing
During the run of PANG-NAV, the RINEX files should be loaded. Specifically, three pop-ups will appear sequentially, asking the user to select:
- one RINEX observation (3.2 version) file (figure 3),
- one RINEX mixed navigation (3.2 version) file (figure 4),
- one RINEX GPS navigation (3.2 version) file (figure 5).
RINEX observation and mixed navigation files are used for the positioning algorithm, RINEX GPS navigation file is used only for retrieve the input data for the Klobuchar ionosphere model.
 Figure 3
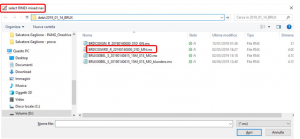 Figure 4
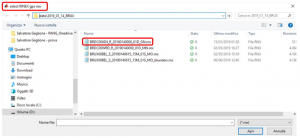 Figure 5
During the data importing phase, on the Command Window it is displayed “ data loading” (figure 6).
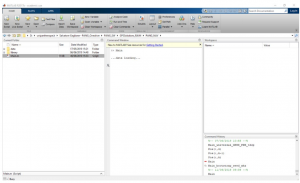 Figure 6
In case an error analysis is required, a ground truth solution must be loaded.The solution must be in Matlab .mat format and should contain a variable called “solution”.The variable “solution” could have the following format:
- A matrix with 4 columns, representing the epochs, the latitude (in degrees), the longitude (in degrees) and the height (in meters).
- A row with 3 elements, representing the latitude (in degrees), the longitude (in degrees) and the height (in meters).
Processing phase
After the importing of the data from the aforesaid RINEX files, the processing phase of the algorithm starts; in this phase, the measurements (specifically the pseudoranges) and the satellite ephemerides are processed to provide the receiver position. The measurements, before being used in least square estimator, are corrected for atmospheric, satellite clock and relativistic errors.
On the Command Window the chosen settings are displayed, followed by “ processing…”, as shown in figure 7.
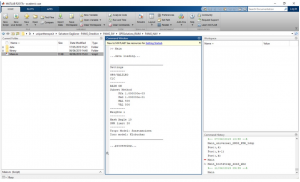 Figure 7
At the end of the processing phase, the sentence “processing successfully completed” appears on the Command Window and the output variables are in Workspace (figure 8)
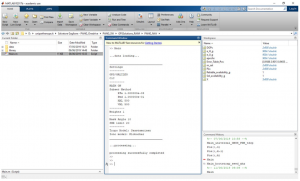 Figure 8
Output
PANG-NAV outputs are receiver position and clock bias, satellite visibility and DOP, solution availability. In case RAIM is active, also RAIM reliability flag, number of rejected measurements, protection levels and reliable availability are provided in output. In case a ground truth is available and the error analysis is required, also error behavior and error metrics are available.
The output variables are:
- DOPs
- e_H_g (optional)
- e_U_g (optional)
- epochs
- Error_Table_Pos (optional)
- nr_sat
- PLs (optional)
- RAIM_Results (optional)
- Reliable_availability (optional)
- Sol_availability
- X
“DOPs” variable is a matrix with 2 rows and a number of columns equal to the number of epochs (let’s call this variable n). In the first row, the PDOP values, before RAIM application, are store, while in the second row, the PDOP values after the RAIM application. Of course, if RAIM is not active or no rejections are performed, the values of first and second rows are the same.“e_H_g” variable is column with n elements, representing the horizontal errors for each epoch.“e_U_g” variable is column with n elements, representing the vertical errors for each epoch.“epochs” variable is column with n elements, representing GPS epochs expressed in seconds of week according to GPS time format.“Error_Table_Pos” variable is a row of 6 elements, representing error metrics as shown in table 1.
Table 1
| Mean horizontal error | Mean vertical error | Root mean square horizontal error | Root mean square vertical error | Maximum horizontal error | Maximum vertical erro |
“nr_sat” variable is a matrix with 2 rows and n columns. In the first row, the numbers of available satellites, before RAIM application, are stored, while in the second row, the numbers of available satellites after the RAIM application. Of course, if RAIM is not active or no rejections are performed, the values of first and second rows are the same.“PLs” variable is a matrix with 2 rows and n columns. In the first row, the values of horizontal protection levels per epoch are stored, while in the second row the vertical protection levels.“RAIM_Results” variable is a matrix with 2 rows and n columns. The first column contains a reliability flag per epoch; the values of the flag have the following meaning:
- if the flag value is 0, there is not enough redundancy to perform the RAIM test;
- if the flag value is 1, the estimated position is reliable (according to RAIM algorithm);
- if the flag value is 2, the estimated position in unreliable (according to RAIM algorithm).
“Reliable_availability” variable is a scalar, indicating the time percentage when the estimated solution is considered reliable by RAIM.
“Sol_availability” variable is a scalar, indicating the time percentage when the estimated solution is simply available, i.e. the number of available satellites are sufficient for the positioning. “X” variable is matrix with 4 (in GPS only case) or 5 (in GPS/Galileo case) rows and n columns. The rows 1, 2 and 3 contain respectively the estimated latitude (in radians), longitude (in radians) and height (in meters) of the GNSS receiver. The 4th row contains the receiver clock bias with respect to GPS system time. The 5th row contains the inter-system offset between GPS and Galileo times.“e_H_g”, “e_U_g” and “Error_Table_Pos” are available only if error analysis is required (Error_Analysis_flag=1).“PLs” and “Reliable_availability” are available only if RAIM is active (RAIM_flag=1).PANG-NAV also provides as output the following plots:
- Horizontal position (easting versus northing)
- Height versus time
- Visibility versus time
- DOPs versus time
- HPL and VPL versus time (only in case RAIM is active)
- Horizontal and vertical errors versus time (only if error analysis is required)
PANG-NAV User Manual – PANG-NAV User Manual –
[xyz-ips snippet=”download-snippet”]