![]() DJI Thermal Analysis Tool 2v1.0User Guide2021.03
DJI Thermal Analysis Tool 2v1.0User Guide2021.03
![]() Searching for KeywordsSearch for keywords such as “battery” and “install” to find a topic. If you are using Adobe Acrobat Reader to read this document, press Ctrl+F on Windows or Command+F on Mac to begin a search.
Searching for KeywordsSearch for keywords such as “battery” and “install” to find a topic. If you are using Adobe Acrobat Reader to read this document, press Ctrl+F on Windows or Command+F on Mac to begin a search.![]() Navigating to a TopicView a complete list of topics in the table of contents. Click on a topic to navigate to that section.
Navigating to a TopicView a complete list of topics in the table of contents. Click on a topic to navigate to that section.![]() Printing this DocumentThis document supports high-resolution printing.
Printing this DocumentThis document supports high-resolution printing.
Introduction
The DJI Thermal Analysis Tool 2 can be used to analyze and process thermal images. By identifying the temperature information of critical areas of the target, the software can be widely used to analyze objects across many industrial applications such as energy equipment, infrastructure inspection, scientific research, and civil surveying. Major incidents can be prevented or addressed quickly by using the software to detect and pinpoint temperature abnormalities in equipment in routine inspections.Operating System RequirementsRecommended: Windows 10 or aboveSupported DevicesMavic 2 Enterprise Advanced, Zenmuse H20T
Usage
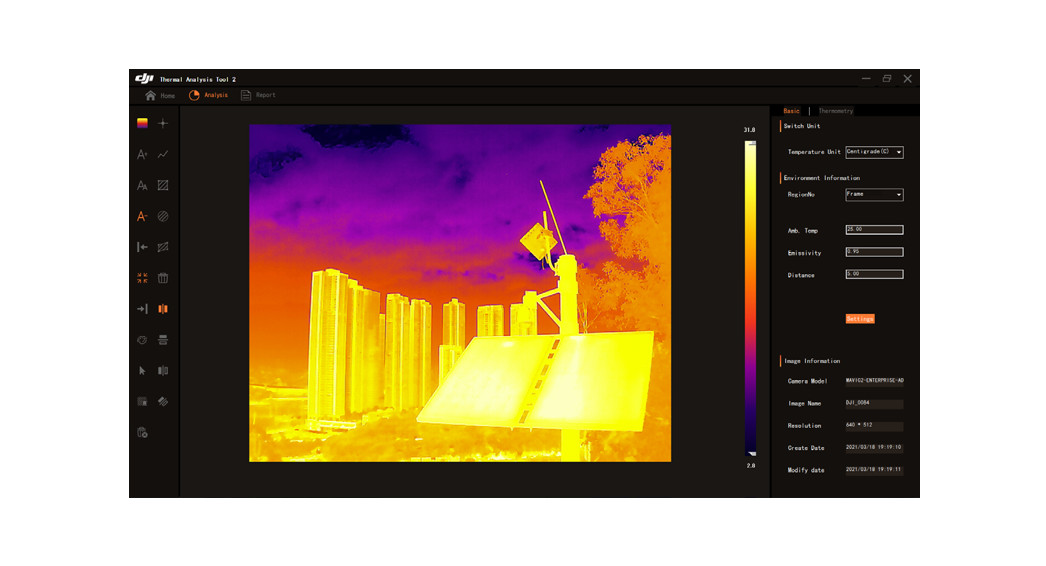
Importing ImagesClick Pic Preview on the Home page and select the folder with the infrared images to be analyzed. The preview images appear as below. Click the image. The interface on the right displays the environmental and image information. Double-click the image to enter the Analysis page.
Temperature Measurement and Analysis
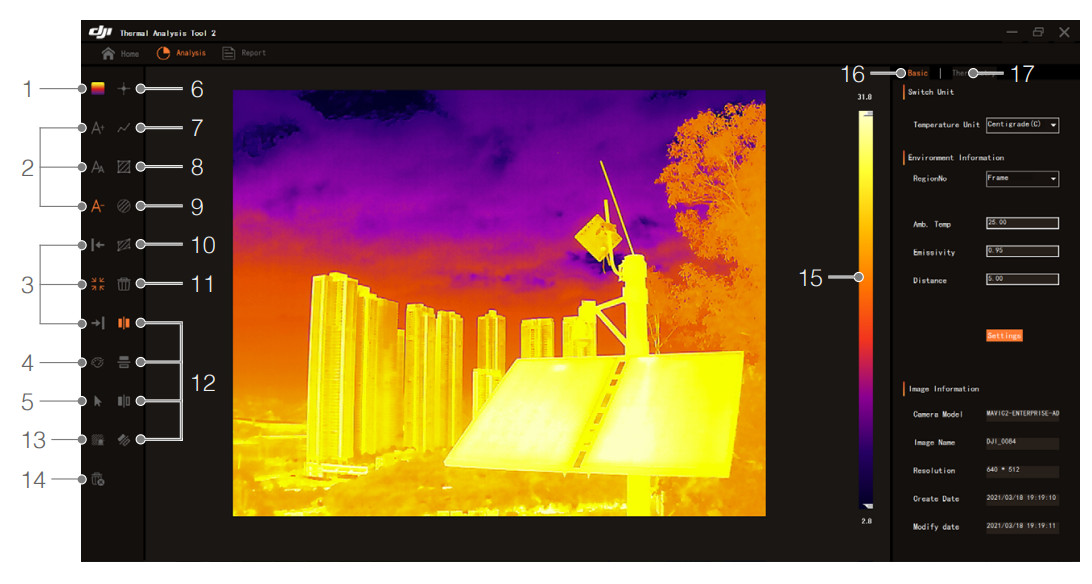
- PaletteClick
 to select a palette to display the thermal image in different pseudo colors. The chroma bar on the right can be used to adjust the color scale of the pseudo color to highlight objects in a specific temperature range.When analyzing the images taken by the Mavic 2 Enterprise Advanced, you can directly drag the chroma bar on the right to adjust the mapping relationship between temperature and color. If you open an image taken by Zenmuse H20T, the isothermal icon must be selected first before adjusting the chroma bar.
 - Font SizeSelect the font size of the temperature information shown on the image. Click, A+, AA, or A-set the font size as large, medium, or small.
- Display PositionSelect the display position of the temperature information shown on the image. Click, or set to display on the left, near the selection, or on the right.
- Text ColorClick to select the text color of the temperature information shown on the image.
- Hover DisplayClick to display the temperature information of the point that the cursor is hovering over.
- Spot MeterClick and left-click the point that needs to be measured in the image. The temperature of that point will be displayed. Drag the point to change the position to measure.
- Line MeasurementClick to measure the highest, lowest, and average temperatures of a straight line. Left-click and drag to draw a straight line. Tap the line and drag to change the length and position.
- Rectangle MeasurementClick to measure the highest, lowest, and average temperatures of a rectangular area. Left-click and drag to select the rectangle area. Tap the rectangle and rag to change the shape and position.
- Circle MeasurementTap to measure the highest, lowest, and average temperatures of a circle area. Left-click and drag to select the circle area. Tap the circle and drag to change the size and position.
- Polygon MeasurementClick to measure the highest, lowest, and average temperatures of a polygon area. Left click to create points of a polygon and then right-click to generate the polygon. Left-click and drag a point of the polygon to adjust the shape and left-click and drag any other area of the polygon to move the shape.
- DeleteAfter selecting the drawn measurement point, line, or area on the image, click to delete the selection.
- Image FlipSelect whether and how to flip the image. indicates that the image is not flipped. Click, or flip the image up vertically, horizontally, or diagonally.
- IsothermThis function is only available when analyzing images taken by a Zenmuse H20T.After selecting the palette, click and adjust the chroma bar on the right to display the image within the temperature range in the selected pseudo color. The temperature outside the temperature range will be displayed as white-hot by default or as black hot by tapping and selecting black hot.
- Delete AllClick to delete all measurements on the image.
- Chroma BarThe chroma bar can be used to adjust the color scale of the pseudo color to highlight measurements in a specific temperature range. Drag the upper and lower range sliders n the chroma bar to change the distribution of the pseudo-color gradation. Left-click and drag in the area between the upper and lower range sliders to change the overall contrast.
- Basic SettingSwitch UnitClick to set the measurement unit as Celsius (°C), Fahrenheit (°F), or Kelvin (K).Environment InformationThe environment parameters of each temperature measurement object can be adjusted. It is recommended to input accurate parameters in order to improve the accuracy of the temperature measurement.Ambient temperature:the ambient temperature will affect the radiation of an object. Environment temperature configurations may affect the accuracy of the temperature measurement. The greater the deviation between the input value and the actual ambient temperature, the greater the inaccuracy of the measurement.Reflected temperature: the surface of the target that is measured may reflect the energy radiated by surrounding objects. This reflected energy may be picked up by the camera along with the radiation, which could cause an error in the temperature reading. Set this parameter as the ambient temperature if there are no objects with extremely high or low temperatures nearby Reflected temperature configurations could affect the measurement. The bigger the difference between the input value and the actual ambient temperature, the greater the inaccuracy of the measurement.Emissivity: the emissivity represents how strongly the surface of the object is emitting energy as thermal radiation. Refer to the Emissivity of Common Materials Table for more information about how to configure emissivity. The surface of the object may be corroded or oxidized, which may cause the actual emissivity value to differ from the reference value. Emissivity configurations may significantly impact the measurement.Distance: the distance from the camera to the target. An infrared detector generates thermal images by receiving infrared radiation from objects. The farther away from the object, the weaker the radiation. The default distance of the camera is factory calibrated. This is the distance at which temperature measurements are the most accurate. Being too close or too far away will result in bigger accuracy errors when measuring.Humidity: the relative humidity of the environment. Configure this parameter based on the actual environment. The default value 70 means that the relative humidity is 70% and the value range is 20 to 100%. Humidity configurations may have a limited effect on the measurement.Click Settings to finish setting all the parameters.Ambient temperature, emissivity, and distance parameters can be set with the Mavic 2 Enterprise Advanced. Reflected temperature, emissivity, distance, and humidity parameters can be set with Zenmuse H20T.Make sure that the parameters are set to meet the format and range requirements in order to maximize the accuracy of measurements.Image InformationShows the image information including camera model, image name, resolution, created time, and last modified time.
- ThermometrySelect a measurement line or an area drawn on the image. A measurement line will display the temperature information of all points on the line in the form of a curve chart and a measurement area will display the temperature distribution of the measurement area in the form of a histogram chart.

Language SettingsThe language can be set in the lower-left corner of the home page. Click to choose between English and Chinese.ZoomZoom in or out by scrolling the mouse wheel up or down.
Exporting Reports
After finishing the temperature analysis, switch to the Report page. Set information such as the header logo and title and click Export to select the export path. The software will generate a PDF report and a Word report in the corresponding path. The report contains the environment information parameters and the thermal image with temperature measurements.Click Export Pic to export an image in BMP format, which contains the current temperature measurements.

DJI Supporthttp://www.dji.com/supportThis content is subject to change.Download the latest version fromhttp://www.dji.comCopyright © 2021 DJI All Rights Reserved.
References
[xyz-ips snippet=”download-snippet”]