![]() GREEN ENERGY FOR OUR PLANET
GREEN ENERGY FOR OUR PLANET
EGM-PWM ENERGY METERUSER MANUAL
EGM-PWM ENERGY METER
Energy Meter
Features
- USB Energy Meter allows insight into your energy consumption (voltage/current/power)
- Power Manager software helps calculate the actual energy costs of your equipment
- The software provides basic power consumption readings (home use) and advanced readings (business/scientific use)
Specifications
- Input: 220-240 V AC 50-60 Hz
- Load max: 10 A
- Power consumption max: 1.2W
- USB 1.1 or 2.0 compatible interface
- Computer measurements: voltage and current measuring (RMS values), true power measuring, real energy consumed during a time period (kWh)
- Measurements range: up to 250 V AC, 10 A (RMS), 2500 W, 22 MW a year
- Measurements accuracy: ± 2% (within 50 W – 2500 W power range)
- Working conditions: (+ 10 to 40) C, below 90 % humidity
- Dimensions: 130 mm x 92 mm x 72 mm Net weight: 0.3 kg
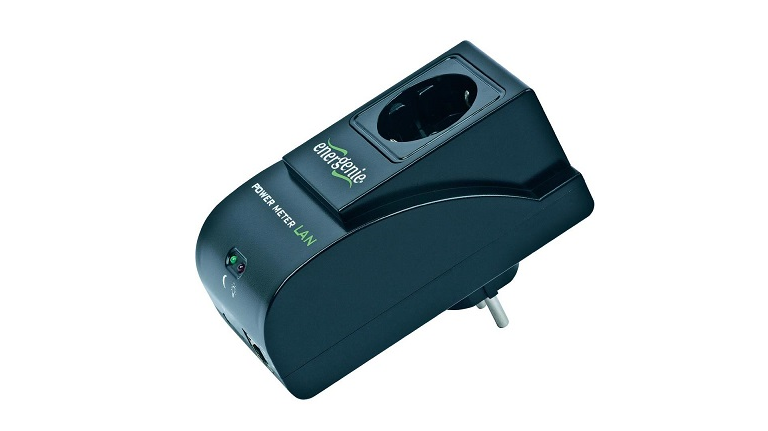
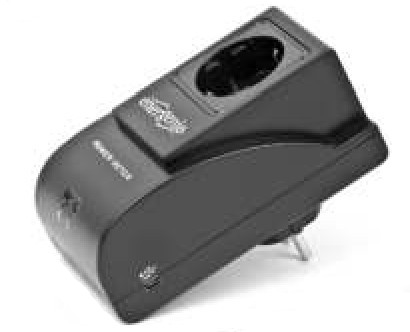
- Indicators and controls of the EGM-PW
 • Indicator “Day/Night mode” is lit it means that the night mode is active (when the day/night mode are enabled see section 7 below)• Indicator “Load” is lit up it means that the connected equipment is consuming energy
 - Hardware requirements•A free USB port• Windows XP/2000/Vista/Windows 7/Windows 8
- Package contents• EGM-PWM• User manual• USB cable• CD with Power Manager software for Windows
- Installation of EGM-PWMTo install your EGM-PWM please follow the steps below:1. Install the Power Manager software (see chapter 5 below).2. Plug the EGM-PWM into the wall socketNote:• Avoid damp or wet places for installation• EGM-PWM should be connected to a European AC wall socket of the DIN 49 440 (German Schuko type) standard• It is possible to connect the EGM-PWM to the power mains via socket strips, surge protectors, voltage regulators or a UPS3. Connect the EGM-PWM (see Figure #1 above) to your computer with the supplied USB cable.4. Plug any device into the Socket (see Figure #1 above) of the EGMPWM and you are ready to measure its energy consumption.5. Software installation• Insert the software CD into the PC CD-ROM drive.• If for any reason the automatic setup does not work, please use the “My computer” window to open the CD-ROM drive folder and launch SETUP.EXE from the CD.• Follow the on-screen instructions of the installation software.• Once the setup is completed the Power Manager software will open automatically (see chapter 6 below).6. Power ManagerYour EGM-PWM has an offline and an online working mode.It is “offline” whenever it is not connected to a PC, or when the PC is turned off. The device will come “online” automatically when it is connected to a PC with the Power Manager software running. In this mode the software keeps downloading the power readings from the EGM-PWM into a database. In the offline mode the EGM-PWM will only save Energy consumption data (kWh), which will be logged into the database when the device comes online again. The measured data can be viewed and analysed with the Power Manager software. The software shows different energy characteristics changing over time including the money spent and the power consumption (kWh). When the software is started, the main power manager window will appear, which shows a list of all connected devices (see Figure #2 below).Push the Device settings button (bottom right here) to set the device-specific options (see Figure #3 below)In the settings screen you are able to change the name of your device (in the Name field) and the data downloading frequency (in the Measurement reading period field) – from 2 to 10 seconds.To delete all previously recorded data, just push the Clear database button.Note:Device IP, Port and Enabled fields will be grey these functions are only available on the LAN version of the EGM-PWMTo open the Power Meter window, select your EGM-PWM device from the list (see Figure #2 above) and then click the Power meter button (see the chapter 7 below).7. Power MeterThe Power Meter window can be opened in either a minimized or maximized mode. The minimized Power Meter window is shown in Figure #4 below. This window is useful for monitoring selected measured values. It displays:• A single measured value (e.g. money spent)Note: Click with the right mouse button over this field to choose a different measured value to display• Two warning indicators. These indicators by default would show you when the voltage is beyond its limits (too high or too low) Note: Read Chapter #9 below if you wish to customize these indicators Figure #4Push Maximize button in this window to open the full-size Power Meter window see Figure #5 below.This window displays all the measured values:• Real power (P)• Active impedance (R)• Frequency of current (Fq)• Energy consumed (E)• The cost of energy consumed (money sign)• RMS voltage (V rms)• Peak voltage (V peak)• RMS current (I rms)• Peak current (I peak)It is beyond the scope of this manual to explain the physical meaning of these values. For most consumers, the energy and its cost are the most interesting.The Energy (E) value shows the accumulated energy consumption (in watt-hours) since a certain date (the last time when the Reset button was pressed). This date is shown below the Cost display. The Cost value is based on the amount of energy consumed and the energy costs. Push the Set button (near the Cost value) to specify the energy costs for your home or office situation see Figure # 6 below.By Pushing the Reset button both Energy and Cost counters will be reset to zero. Figure #6Choose the rate (per kWh) and currency. If you have different rates for peak hours and off-peak hours, just check the box Use Day/Night modes. You will then be able to enter the dual rates and the start/finish times for these modes.8. Using the chartsIn the online mode the values of P, R, Fq, Irms, Vrms and Cost are continuously logged into the database. These readings can be used to build time charts. To display the charts just click on the desired value in the Main Power Meter window (see Figure #5 above) or push the Chart button in the Power Manager window (see Figure #2 above). This will open the Chart window as displayed in Figure # 7 below.The horizontal axis represents the date/time and the vertical axis represents the values of the chosen parameter.Note: The scale of the vertical axis changes automatically once you browse or zoom the chart. The scale will be chosen in such a way that all the values within the displayed time period fit onto the screen. Some extra tools are placed under the chart:• From the Displayed value list box you can choose the value which you wish to display in the graph area…• The displayed chart normally shows the average values of the chosen parameter. You can determine the data point density with the Graph details level slider. With this slider, you actually change the number of points within the chosen time interval for the averaging. Fewer points mean less details and a smoother chart. More points mean more details and a more precise chart.• ∑The Sum tool is used to calculate energy statistics within a selected time period. Push the ∑ button to activate this feature and then select a time period on the chart area by dragging and dropping with the left mouse button. Doing so you will select the period as shown on the Figure # 8 below. The chosen period will be selected on the chart and the start and finish values of the interval will be shown in the corresponding fields inside Statistics for the period box. The calculated average value will be shown in the Mean value field. Tip: You can calculate the total energy consumption within a certain period using this function in Real power chart.Note: you can also adjust the Start and Finish fields manually.• The zooming tool allows changing the time scale of the chart. Push the zooming tool button and then click with the left mouse button to adjust the scale to the desired level• When you select the home tool, the chart displays every record from the whole period where the selected parameter has any records in the database• The Excel tool exports the average values of the selected period into an Excel file for further analysis or archiving see Figure #9 below.9. Advanced featuresThe Power Manager software also allows you to define a number of user-defined events. Possible events are: Lighting up the indicators in the Power Meter window (see Chapter 7 above), or run a user-specified application. To set the parameters for such events (see Figure #10 below), just push the Events button in the Power Manager window (see Figure #2 above)To define your event, first choose the parameter of your interest from the Value list box. If you wish the event to be triggered when the value of this parameter exceeds a certain maximum fill in the Max field then. If you wish the event to be triggered when the value of this parameter drops below a certain minimum fill in the Min field. Secondly, you select the desired action from the Action list box. If you choose to execute a specific application or program, you can select the path to this application in the Path field. It is possible to give the event a practical name in the Name field.Select the Use growth checkbox if you are interested in the difference between the current value of the parameter and its previous value, rather than in its absolute value.Tip: Use growth checkbox might be particularly useful if you wish to do something whenever a certain device gets switched on or off.
 • Indicator “Day/Night mode” is lit it means that the night mode is active (when the day/night mode are enabled see section 7 below)• Indicator “Load” is lit up it means that the connected equipment is consuming energy
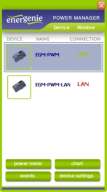 Push the Device settings button (bottom right here) to set the device-specific options (see Figure #3 below)
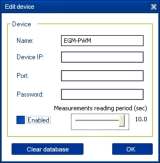 In the settings screen you are able to change the name of your device (in the Name field) and the data downloading frequency (in the Measurement reading period field) – from 2 to 10 seconds.To delete all previously recorded data, just push the Clear database button.Note:Device IP, Port and Enabled fields will be grey these functions are only available on the LAN version of the EGM-PWMTo open the Power Meter window, select your EGM-PWM device from the list (see Figure #2 above) and then click the Power meter button (see the chapter 7 below).7. Power MeterThe Power Meter window can be opened in either a minimized or maximized mode. The minimized Power Meter window is shown in Figure #4 below. This window is useful for monitoring selected measured values. It displays:• A single measured value (e.g. money spent)Note: Click with the right mouse button over this field to choose a different measured value to display• Two warning indicators. These indicators by default would show you when the voltage is beyond its limits (too high or too low) Note: Read Chapter #9 below if you wish to customize these indicators Figure #4
 Push Maximize button in this window to open the full-size Power Meter window see Figure #5 below.
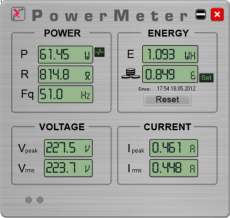 This window displays all the measured values:• Real power (P)• Active impedance (R)• Frequency of current (Fq)• Energy consumed (E)• The cost of energy consumed (money sign)• RMS voltage (V rms)• Peak voltage (V peak)• RMS current (I rms)• Peak current (I peak)It is beyond the scope of this manual to explain the physical meaning of these values. For most consumers, the energy and its cost are the most interesting.The Energy (E) value shows the accumulated energy consumption (in watt-hours) since a certain date (the last time when the Reset button was pressed). This date is shown below the Cost display. The Cost value is based on the amount of energy consumed and the energy costs. Push the Set button (near the Cost value) to specify the energy costs for your home or office situation see Figure # 6 below.By Pushing the Reset button both Energy and Cost counters will be reset to zero. Figure #6
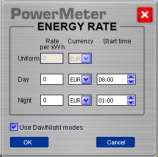 Choose the rate (per kWh) and currency. If you have different rates for peak hours and off-peak hours, just check the box Use Day/Night modes. You will then be able to enter the dual rates and the start/finish times for these modes.8. Using the chartsIn the online mode the values of P, R, Fq, Irms, Vrms and Cost are continuously logged into the database. These readings can be used to build time charts. To display the charts just click on the desired value in the Main Power Meter window (see Figure #5 above) or push the Chart button in the Power Manager window (see Figure #2 above). This will open the Chart window as displayed in Figure # 7 below.
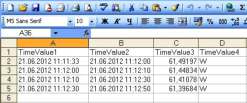
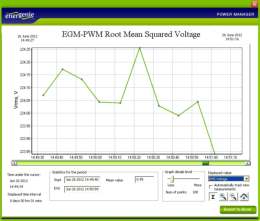 The horizontal axis represents the date/time and the vertical axis represents the values of the chosen parameter.Note: The scale of the vertical axis changes automatically once you browse or zoom the chart. The scale will be chosen in such a way that all the values within the displayed time period fit onto the screen. Some extra tools are placed under the chart:• From the Displayed value list box you can choose the value which you wish to display in the graph area…• The displayed chart normally shows the average values of the chosen parameter. You can determine the data point density with the Graph details level slider. With this slider, you actually change the number of points within the chosen time interval for the averaging. Fewer points mean less details and a smoother chart. More points mean more details and a more precise chart.• ∑The Sum tool is used to calculate energy statistics within a selected time period. Push the ∑ button to activate this feature and then select a time period on the chart area by dragging and dropping with the left mouse button. Doing so you will select the period as shown on the Figure # 8 below. The chosen period will be selected on the chart and the start and finish values of the interval will be shown in the corresponding fields inside Statistics for the period box. The calculated average value will be shown in the Mean value field. Tip: You can calculate the total energy consumption within a certain period using this function in Real power chart.Note: you can also adjust the Start and Finish fields manually.
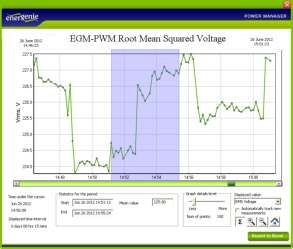 •
•  9. Advanced featuresThe Power Manager software also allows you to define a number of user-defined events. Possible events are: Lighting up the indicators in the Power Meter window (see Chapter 7 above), or run a user-specified application. To set the parameters for such events (see Figure #10 below), just push the Events button in the Power Manager window (see Figure #2 above)
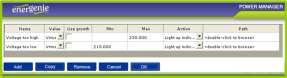 To define your event, first choose the parameter of your interest from the Value list box. If you wish the event to be triggered when the value of this parameter exceeds a certain maximum fill in the Max field then. If you wish the event to be triggered when the value of this parameter drops below a certain minimum fill in the Min field. Secondly, you select the desired action from the Action list box. If you choose to execute a specific application or program, you can select the path to this application in the Path field. It is possible to give the event a practical name in the Name field.Select the Use growth checkbox if you are interested in the difference between the current value of the parameter and its previous value, rather than in its absolute value.Tip: Use growth checkbox might be particularly useful if you wish to do something whenever a certain device gets switched on or off.
Waste disposal:
![]() Do not deposit this equipment with the household waste. Improper disposal can harm both the environment and human health. For Information about waste collection facilities for used electrical and electronic devices, please contact your city council or an authorized company for the disposal of electrical and electronic equipment.
Do not deposit this equipment with the household waste. Improper disposal can harm both the environment and human health. For Information about waste collection facilities for used electrical and electronic devices, please contact your city council or an authorized company for the disposal of electrical and electronic equipment.
WARRANTY CONDITIONS
GARANTIE BEDINGUNGEN
The warranty period is 24 months and begins with the sale to the end-user. The receipt must clearly list the date of purchase and the part number, in addition it should be printed. Keep the receipt for the entirewarranty period since it is required for all warranty claims. During the warranty period the defective items will be credited, repaired or replaced at the manufacturer’s expense. Work carried out under the warranty neither extends the warranty period nor starts a new warranty period. The manufacturer reserves the right to void any warranty claim for damages or defects due to misuse, abuse or external impact (falling down, impact, ingress of water, dust, contamination or break). Wearing parts (e.g. rechargeable batteries) are excluded from the warranty. Upon receipt of the RMA goods, Gembird Europe B.V. reserves the right to choose between replacement of defective goods or issuing a credit note. The credit note amount will always be calculated on the basis of the current market value ofthe defective products
Gembird Europe B.V.Wittevrouwen 56, 1358CD AlmereThe Netherlandswww.gembird.nl/support[email protected]Tel. +31-36-5211588All brands and logos are registered trademarks of their respective owners
References
[xyz-ips snippet=”download-snippet”]