Instruction Manual
Zeiss Mastering GPA
Using Guided Progression Analysis to Quantify Status, Measure Change and Assess Rate of Progression for Better Disease Management.
Keeping Up with Glaucoma
Event and trend analysis are critical components in the management of glaucoma both support earlier diagnosis and more accurate tracking of progression.
In managing glaucoma, the doctor’s primary goal is minimizing the risk of visual disability during the lifetime of the patient. According to Robert N. Weinreb, MD, achieving this goal requires a comprehensive strategy that includes staging the disease, estimating life expectancy and evaluating the past rate of disease progression based on visual fields, the retinal nerve fiber layer (RNFL) and changes in the optic disc.
Progression can be evaluated in the clinic by one of two approaches. One approach, known as event-based analysis, involves evaluating change from baseline. The second approach, known as trendbased analysis, involves estimating the rate of change. Change from baseline is typically more sensitive than rate of change; however, rate of change is essential for judging whether a patient is at risk for vision loss during his or her lifetime. Historically, estimating rate of change, i.e., rate of progression, has been more difficult.
Why Determining Rate of Disease Progression is a Challenge
Landmark research efforts, such as the Ocular Hypertension Treatment Study (OHTS) and the Early Manifest Glaucoma Trial (EMGT), have been of some help in this regard. Data analysis from OHTS identified risk factors, such as larger vertical cup/ disc ratio, thinner central corneal thickness, older age and higher IOP, that can help in estimating the potential risk of a patient’s progression from ocular hypertension to glaucoma. Similarly, EMGT showed that certain risk factors can help in predicting which patients with established glaucoma will move through the disease continuum. “Rate of progression is highly individual among patients, and not all patients progress at vision-threatening rates,” says Dr. Weinreb, Chairman and Distinguished Professor of Ophthalmology, Morris Gleich MD Chair of Glaucoma, and Director of the Hamilton Glaucoma Center at the University of California San Diego. Furthermore, says Dr. Weinreb, “It has been fairly time-consuming to do a sufficient amount of testing to estimate progression. We have not had the analytic methods necessary to efficiently estimate rate of progression in clinical practice. Doctors have had to rely on evaluation of visual field tests and their clinical examination of the optic disc or RNFL.” Also, it is difficult to differentiate true progression from variations in patient physiology and test performance and clinician interpretation.
“ We now have software available for both structural and functional testing that can provide clinicians with the relevant quantitative and statistical analysis to objectively measure progression.”— Robert N. Weinreb, MD
A Welcome Technological Advance
Ideally, doctors should be able to go beyond estimating glaucoma progression and quantitatively and reproducibly measure it, Dr. Weinreb comments. Today, after years of working with glaucoma experts and other scientists, ophthalmic device manufacturers have been able to deliver meaningful advances in this area. “We now have software available for both structural and functional testing that can provide clinicians with the relevant quantitative and statistical analysis to objectively measure progression,” Dr. Weinreb says.
For example, Guided Progression Analysis™ (GPA™) software is available for two ZEISS instruments: the Humphrey® Field Analyzer and the Cirrus™ HD-OCT. GPA enables doctors using Humphrey visual field testing to specifically assess change from baseline and the rate of change of visual field loss over time. They can see at a glance whether vision has changed for each individual patient and can subsequently identify how rapidly visual field loss is progressing. Building on the proven performance of Cirrus HD-OCT in RNFL measurement
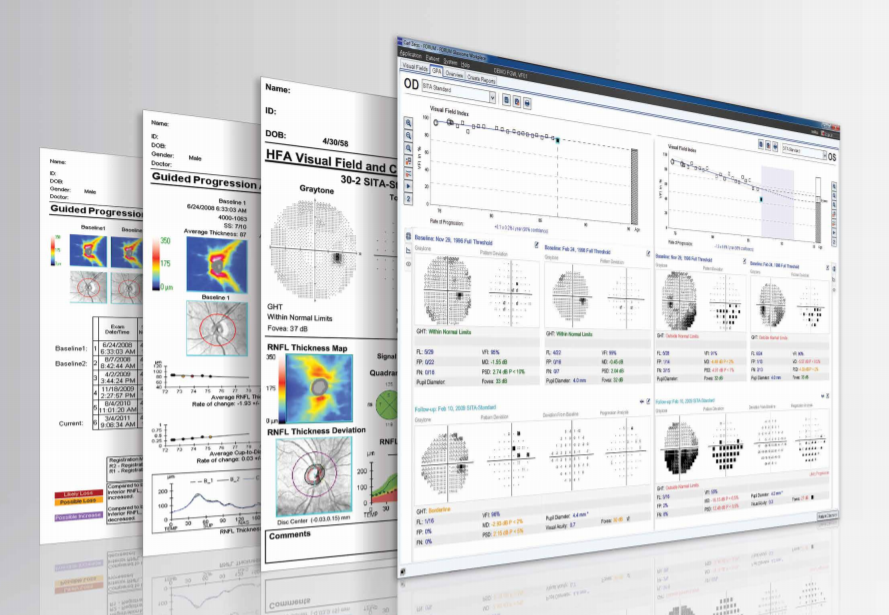
GPA Summary Report for HFA
The diagnosis and management of glaucoma relies on the critical assessment of visual field test status and progression. The GPA Summary Report can help estimate the current stage of visual loss and rate of progression, to support the assessment of a patient’s risk of future vision loss. Here is an example as seen via FORUM® Glaucoma Workplace.
reproducibility (within a standard deviation of 1.2 μm for glaucomatous patients) the addition of GPA alerts physicians to statistically significant changes in RNFL thickness as well as when a rate of RNFL change reaches statistical significance.
The ability to measure rates of disease progression across both structure and function is crucial for optimal management of glaucoma patients, Dr. Weinreb says. “Structural and functional information with current testing techniques are not interdependent. If a change in the visual field is observed, there is not necessarily a change in the optic disc. Structure can predict function in many patients, but that is not always the case. In some patients, function can predict structure. Structural and functional testing are complementary. One should not be used at the exclusion of the other.”
Safeguarding Patients’ Vision
Dr. Weinreb says the latest glaucoma progression analysis tools help physicians to meet one of the most important challenges in treating patients with glaucoma, which is to detect patients whose disease is worsening rapidly. “It is important to identify them because they can benefit from more frequent examination or more aggressive therapy,” he says. “It is equally important to know which patients are progressing slowly because they may not need to be examined as often and might not need as intensive therapy. While these new tools should never replace the clinical judgment of the physician, the improved understanding of the rate of disease progression they offer provides the best chance of minimizing visual disability for our patients.”
Reprinted from A Better Approach to Glaucoma, a special supplement to Ophthalmology Management, October 2010.
Preferred Practice Guidelines from the AAO for POAG
Because primary open-angle glaucoma (POAG) can be asymptomatic while also doing great damage to the optic nerve in its early stages, it is critical to detect this disease as soon as possible. The American Academy of Ophthalmology (AAO) recommends a detection process that first assesses a patient’s risk factors and that also utilizes such important traditional tools as visual fields and gonioscopy to achieve a confirmed diagnosis.
According to the AAO practice guidelines for POAG, a visual field for the glaucoma-suspect patient is a key step in assessing “possible glaucomatous disease in the absence of clinical signs of other optic neuropathies.” Gonioscopy is also important in identifying glaucoma suspect patients, according to the AAO guidelines, as “the diagnosis of POAG requires careful evaluationof the anterior chamber angle to exclude angle closure or secondary causes of IOP elevation.”1
Once the disease state has been confirmed, the main goal of the clinician, according to the AAO, is to “maintain the IOP in a range at which the patient is likely to remain stable.” Here again,the role of regular visual fields testing is critical in monitoring patients for any signs of disease progression.
The chart below shows the recommended follow-up evaluation for patients with POAG.1
Recommended Guidelines for Follow-up Glaucoma Status Evaluations with Optic Nerve and Visual Field Assessment*1
The chart is based on Level B (moderately important) and Level III (evidence obtained from one of the following: descriptive studies, case reports or reports of expert committees/ organizations (e.g., PPP panel consensus with external peer review).
IOP = intraocular pressure; NA = not applicable
* Evaluations consist of clinical examination of the patient, including optic nerve head assessment (with periodic color stereophotography or computerized imaging of the optic nerve and retinal nerve fiber layer structure) and visual field assessment.
** Patients with more advanced damage or greater lifetime risk from POAG may require more frequent evaluations. These intervals are the maximum recommended time between evaluations.
REFERENCE1. American Academy of Ophthalmology Glaucoma Panel. Preferred Practice Pattern Guidelines. Primary Open-Angle Glaucoma Suspect Summary Benchmark — 2013. Available at: www.aao.org/ppp. Accessed Sept. 2, 2014.
Tracking Structural and Functional Glaucomatous Change Using
Guided Progression Analysis for the Humphrey Perimeter and the Cirrus HD-OCT
By Vincent Michael Patella, Vice President,Professional Affairs at Carl Zeiss Meditec, Inc.
For years, the rate of a patient’s visual field change was determined using mean deviation — the average change relative to age-corrected normal sensitivity. Today, the Humphrey® Visual Field Index (VFI™) is the number we prefer, because it’s less affected by cataract and changes in pupil size. Doctors are looking at the same visual field results they’ve always used, but they’re assessing rate of change in a different way.
VFI estimates the overall percentage of loss on each visual field. You can retrospectively go back and calculate VFI on any Humphrey 24-2 or 30-2 threshold visual field ever done since the introduction of the HFA™ in 1984. VFI is weighted to emphasize the central visual field more heavily than the peripheral field and it’s adjusted to at least partially correct for the effects of cataract. VFI was designed to be as reflective as possible of ganglion cell damage. We know there is about 8 or 9 times the density of ganglion cells in the center of the retina as in the periphery, and therefore VFI was designed to give considerably more weight to the central field. Central field functionality also is more important to the patient, so it makes sense from that point of view as well. The standard HFA Guided Progression Analysis™ (GPA™) automatically presents VFI information for all available visual field tests. A linear regression analysis is performed as soon as the patient has completed five tests.
With Cirrus, we’re dealing with a million times as much data as with visual fields. We capture a 3D image of the whole area around the optic nerve and store it all as a data cube. This is a detailed 3D image of the optic nerve and the surrounding retina. From that, we can determine the thickness of the RNFL, as well as a number of different tilt-compensated measurements of the optic nerve head. Our optic nerve analysis uses the termination of Bruch’s membrane to automatically define optic nerve size, exactly in line with current thinking. If there are multiple optic nerve data cubes collected over time, we use Cirrus™ GPA to align the cubes and then look for change that exceeds typical test-retest variability— an analysis that is conceptually very similar to that of the Humphrey GPA. Standard macular data cubes can now be analyzed to estimate ganglion cell density in the central retina.
We know that many doctors have branch offices, multiple perimeters and archival needs. So, we’ve also created a product called FORUM® that can combine data from multiple perimeters into a single database and store it on a central server. As long as all instruments are connected to the same server, each HFA has access to all tests. You can similarly combine data from multiple Cirrus HD-OCT instruments into a single centralized database.
FORUM also allows us to combine test results from the HFA and the Cirrus HD-OCT into a single report. Doctors have told us they want to see not only if the perimetry is stable, but also what the structure looks like — and how well the two measurements correlate. We believe that this streamlined process will help doctors concentrate more on what they do best — delivering high quality healthcare.
GPA analyses of Humphrey perimetry and Cirrus HD-OCT data both can now be efficiently used to help doctors assess rate of progression as well as progression events. This represents a major change in the way we are now suggesting that doctors think about glaucoma management. In my view, it’s no longer a question of “did the patient get worse?” We know that most glaucoma patients progress, even if ever so slowly. Today, it also is a matter of how fast, and GPA can help us assess both structural and functional change more effectively.
Cirrus HD-OCT GPA Report
With Guided Progression Analysis (GPA), Cirrus HD-OCT can perform event analysis and trend analysis of RNFL thickness and ONH parameters (e.g. Average Cup-to-Disc ratio). Event analysis assesses change from baseline compared to expected variability. If change is outside the range of expected variability, it is identified as progression. Trend analysis looks at the rate of change over time, using linear regression to determine rate of change.
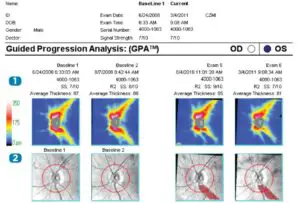
- RNFL Thickness Maps provide a color-coded display of RNFL for two baseline exams and the two most recent exams.
- RNFL Thickness Change Maps demonstrate change in RNFL thickness. Up to 8 exams are automatically registered to baseline for precise point-topoint comparison. Areas of change are color-coded yellow when first noted and then red when the change is sustained over consecutive visits.
- RNFL Thickness (Average, Superior, and Inferior) and Average Cup-to-Disc Ratio values are plotted for each exam. Orange marker denotes change when it is first noted. Maroon marker denotes change sustained over consecutive visits. Rate of change is shown in text.
- RNFL Thickness Profiles TSNIT values from exams are plotted. Areas of statistically significant change are color coded orange when first noted and maroon when the change is sustained over consecutive visits.
- RNFL/ONH Summary summarizes Guided Progression Analysis (GPA) analyses and indicates with a check mark if there is possible or likely loss of RNFL
RNFL Thickness Map Progression (best for focal change)RNFL Thickness Profiles Progression (best for broader focal change)Average RNFL Thickness Progression (best for diffuse change)Average Cup-to-Disc Progression (best for global change)
GPA: A Better Way of Looking at Glaucoma

By Nathan Radcliffe, MD
Traditionally, visual field assessment has required testing the patient, then comparing his results to a normative database. In the past, we often defined patients as having glaucoma when their visual field test was outside normal limits. But, as we all know, some patients have stellar visual field performance while others do not. In some situations, it may not be appropriate to compare a patient to a group of “normal” patients. Ideally, you should be able to compare that patient to his previous performance.
With the aid of Guided Progression Analysis™ (GPA™) software from Carl Zeiss Meditec, we are finally able to address glaucoma in an ideal manner by evaluating it as a disease of change. More precisely, glaucoma is a disease of deterioration — of either visual function or of retinal nerve fiber tissue. The best way to manage glaucoma is to determine the rate at which the disease is changing — either functionally or structurally. Carl Zeiss Meditec has given us tools to evaluate change from both standpoints, using the same GPA language to evaluate perimetry with the Humphrey® Field Analyzer (HFA), and OCT with the Cirrus™.
We know there’s a great deal of fluctuation inherent in glaucoma. There’s fluctuation of intraocular pressure, of visual field performance, and to some extent, fluctuation (or noise) in some of the imaging test values. Glaucoma specialists minor in statistics; we know that one way to overcome fluctuation is to increase the rate at which we sample.
My strategy for detecting change, whether structural or functional, is to make multiple assessments. I begin by conducting two baseline visual field tests within a short time interval — anywhere between 6 weeks and 3 months of initial diagnosis. On average, I obtain two perimetric evaluations a year. There are patients at higher risk of progression and I assess them more frequently; likewise I assess stable patients less frequently.
Comparing Apples to ApplesWith the overall strategy that Carl Zeiss Meditec has employed, you can use the same vocabulary to talk about visual fields and OCT, which is ideal because they’re two different representations of the same disease process. In some cases, you may detect a glaucoma patient because of abnormal RNFL thickness compared to a normative database. In other cases, you may have a patient with normal RNFL thickness who is diagnosed with glaucoma because he has changed compared to his own baseline.
“ With the aid of Guided Progression Analysis (GPA) software from Carl Zeiss Meditec, we are finally able to address glaucoma in an ideal manner by evaluating it as a disease of change.”— Nathan Radcliffe, MD
Using the GPA software on the Cirrus, we can evaluate the patient’s loss of RNFL over time compared to his own baseline, which is a composite of two initial examinations. I’ve seen considerable variation in the thickness of the RNFL between healthy patients, so it makes much more sense to compare a patient to himself and his own historic baseline.
Additionally, we can use the visual field and optic nerve information together to perform structure function assessments with greater sensitivity. I may, for example, have a patient with a borderline superior arcuate scotoma, which appears very early in the visual field test in her right eye.
When I am obtaining the OCT, I can lower my threshold for what I consider to be a glaucomatous defect, providing that it agrees with my functional assessment. So, by looking for a structure-function relationship using these two devices, I can determine that someone may have glaucoma even if she just has a borderline thinning in her RNFL —as long as it agrees with the borderline area of the visual field. Using the two devices together allows for greater sensitivity and specificity in diagnosis.
Similarly, you can see structure-function relationships in terms of progression. On the visual field test, the event-based GPA may tell you that a patient has possible progression in one area, and it can tell you this in as few as 3 visual field tests. You could obtain two more visual field tests to further clarify the likelihood of progression. Another strategy may be to repeat your OCT and look to see if there’s been any deterioration in the corresponding region of nerve fiber layer.
Event and Trend AnalysisIn general, there are two ways of telling whether a visual field or OCT has progressed: event-based and trend-based analysis. Both are available through GPA. The advantage to defining an event is that you can achieve it fairly quickly. For example, in the Early Manifest Glaucoma Trial, the investigators wanted a fairly sensitive measure of field progression, particularly since half of the patients in that study were randomized to placebo. For this study, they defined progression as at least three significantly progressing points at the same locations in three consecutive tests on the pattern deviation plot. This has now been incorporated into the HFA’s GPA alert.1 While this analysis can quickly tell us if the patient has progressed, it won’t provide his rate of progression. A trend-based analysis takes longer to determine, but provides more information. You need at least four assessments for OCT; five for visual fields. You’re calculating a slope or performing regression analysis and you need data for that. The advantages are that you can get information on the rate of field progression and also get a sense of variability by looking at the confidence intervals around that rate and the significance of the slope of progression.
The HFA measures the Visual Field Index™ (VFI™), an age-adjusted and center-weighted assessment of the overall percentage of the remaining visual field. This global index best answers the question, “Doctor, how much visual field do I have remaining?” HFA answers this question in a way that reflects a patient’s age and is also sensitive to the fact that central vision is more important to our patients than peripheral vision. In the visual cortex, central regions of vision are “weighted” by receiving a greater degree of cortical magnification. The relationship is linear and declines with eccentricity such that a region of visual field one degree more eccentric will receive about half of the visual cortex than the more central area.2 Carl Zeiss Meditec took that same central weighting and applied that to the visual field, so the VFI better represents the functional importance of vision to your patient. Additionally, after several exams we can create a plot of a patient’s VFI over time. The plot can tell you if the patient is losing vision and how quickly, along with a 5-year projection of total field remaining if the progression continues at the same rate. It will also tell you if the slope of that regression line is significant.
You can review this information with your patient to help him better understand his condition with intuitive and more concise language. I’m often surprised how two patients with similar VFI plots will feel differently about the projected loss of vision, and this information allows me to better engage my patients in a dialogue about their disease. The bottom line is that we’re closer now than ever to being able to deal with glaucoma on its own terms. By doing so, we can assess the rate at which our patient is deteriorating and adjust our therapy to that rate of change.
Nathan Radcliffe, MD, is a cataract and glaucoma surgeon at the New York Eye Surgery Center and is a clinical assistant professor of ophthalmology and director of the glaucoma service at NYU Langone Ophthalmology Associates.
References
- Bengtsson B, Lindgren A, Heijl A, Lindgren G, Asman P, Patella M. Perimetric probability maps to separate change caused by glaucoma from that caused by cataract. Acta Ophthalmol Scand. April 1997;75:184-188.
- Levi DM, Klein SA, Aitsebaomo AP. Vernier acuity, crowding, and cortical magnification. Vision Res. 1985;25:963-977.
GPA Summary Report — Sample Case
Likely progression
This is an example of a patient with statistically significant and possibly clinically significant progression. This patient’s visual field loss is measurably progressing based upon the GPA alert and the VFI slope. The patient may be at significant risk of further visual loss in the future. These findings must be considered in the context of patient life expectancy and also relative to the possible risks associated with any contemplated escalation in treatment.

Monitoring GlaucomaProgression
By Vincent Michael Patella, Vice President,Professional Affairs at Carl Zeiss Meditec, Inc.
As a result of work over the past decade, many doctors have become more interested in knowing how fast a patient is getting worse and whether or not that rate is acceptable. In other words, given the patient’s life expectancy and given his or her current state of vision, what is the risk that this patient will become visually disabled in his or her lifetime? If there is significant risk of visual disability in the patient’s lifetime, then it may be necessary to adjust therapy.
In my view, managing glaucoma patients has evolved to be an activity in which you monitor staging, rates of change and life expectancy. In a typical scenario, the doctor makes the diagnosis that the patient has glaucoma, determines how much damage already exists, and decides what therapy is most appropriate. Then the question becomes one of determining if the patient is progressing under current therapy and, if so, how fast.
Determining the rate of progression may require investment of considerable diagnostic effort during the first few years after diagnosis. Only a fraction of glaucoma patients progress at vision-threatening rates — perhaps 15%. The other 85% may be fine with their current treatment, needing continued monitoring but no urgent change in therapy. Under this philosophy, the emphasis is on determining if this is the one patient in seven who is progressing so rapidly that he or she needs more aggressive treatment. If they’re not at high risk, you will, of course, continue to monitor their status. Those who are progressing more rapidly will then have the benefit of being considered for early and appropriate adjustments in therapy. Compared to twenty years ago, this represents a real change in the way we think about glaucoma management, but it probably isn’t very different from how other diseases are managed.
The two techniques for quantitative progression assessment are change from baseline — also known as event detection — and rate of change. Progression software should include both analyses, because detection of statistically significant change events is typically more sensitive and can be done sooner than rate of change. Rate of change estimation usually takes longer but provides critical information to help judge whether the patient is at risk for vision loss during their life expectancy. Guided Progression Analysis™ (GPA™ ) software from Carl Zeiss Meditec features both assessments. GPA is standard on the Humphrey® Field Analyzer (HFA™), and also on the Cirrus™ HD-OCT.
The HFA measures visual field sensitivity, and Cirrus measures retinal nerve fiber layer thickness (RNFL), optic nerve parameters, and parameters related to ganglion cell thickness. For both instruments, the goal of GPA is to quickly identify change events that statistically exceed expected and normal testing variability and then to estimate the rate of change in parameters of interest for each instrument. Change events alert you as to which patients may need more careful assessment of rate of progression. Knowing the rate of progression helps you assess the clinical significance of the observed change. We recognize that there is a difference between statistical significance and clinical significance, and our goal is to help you bridge that gap.
This strategy frontloads the diagnostic investment. In essence, we’re saying let’s spend some intensive effort evaluating our glaucoma patients soon after diagnosis. Is their disease progressing quickly, slowly, or not at all? Once we’ve figured out who they are, we can focus our healthcare resources on the fast progressors, and perhaps manage less aggressively those who have demonstrated over the course of their clinical management that they are at minimal risk.
Visual Field Index Graph
Standardizing Image Management

By Michael V. Boland, MD, PhD
Digital imaging and communications in medicine (DICOM) is a standard for handling, storing, printing and transmitting medical imaging. By tagging images with a patient’s demographic information, DICOM allows images obtained from various devices from multiple manufacturers to be integrated into a picture archiving and communication system (PACS).
“A good example of a DICOM-compatible image review system in ophthalmology is FORUM® (Carl Zeiss Meditec), which we’re evaluating in our practice,” says Michael V. Boland, MD, PhD, Johns Hopkins University. “In general, a DICOM-compatible system captures patients’ demographic information from your patient registration system and produces a work list for a particular device. If a patient comes in for an OCT, for example, the system sends a list ofpatients to the OCT machine, the technician chooses the correct patient from the list and performs the test. This eliminates the potential for data entry errors and, as a result, enhances patient safety and practice efficiency.”
“ Implementation of a DICOM-compatible work flow reduced the need to enter or edit patients’ demographic information by 50% and reduced the need to manage misfiled images by 85%.” 1
In fact, a study at the Wilmer Eye Institute of Johns Hopkins University showed that implementing a DICOM-compatible work flow reduced the need to enter or edit patients’ demographic information by 50% and reduced the need to manage misfiled images by 85%.1
“The OCT machine pushes the data back to the image management system, creating a closed loop of registration to image management to device back to image management,” Dr. Boland explains. “That’s the system you would use as the clinician to review those scans in the clinic. We’ve found the technology very beneficial for clinic productivity in terms of less technician time wasted entering data and less staff time wasted reconciling errors that occur when a patient’s information is mistyped.
“With FORUM, we’ve been able to integrate all of our visual fields, all of our OCT machines, lens measurements and corneal topography across ten geographic locations. As more vendors implement the DICOM standards, it’s becoming easier to add devices to the system.”
Dr. Michael Boland is an assistant professor and director of information technology at the Wilmer Eye Institute at Johns Hopkins University, Baltimore. He is a member of the Medical Information Technology Committee of the American Academy of Ophthalmology.
Reference
- Pandit R, Boland MV. The impact on staff efficiency of implementing a DICOM-compatible workflow in an academic ophthalmology practice. Invest Ophthamol Vis Sci. 2013;54:ARVO E-Abstract 2317.
Reprinted from “Improving Efficiencies and Outcomes in the Glaucoma Practice,” a special supplement to the May/June 2014 edition of Ophthalmic Professional.
Did you know?
With FORUM® Glaucoma Workplace, in a matter of seconds, you can easily adjust your baseline exams for post-operative assessments?
GLA 6525 Rev B © 2014 Carl Zeiss Meditec, Inc..

Read More About This Manual & Download PDF:
 report this ad
Zeiss Mastering GPA Instruction Manual – Zeiss Mastering GPA Instruction Manual –
Questions about your Manual? Post in the comments!
[xyz-ips snippet=”download-snippet”]