
ZUMI Measurement Instruments Manual
Introduction
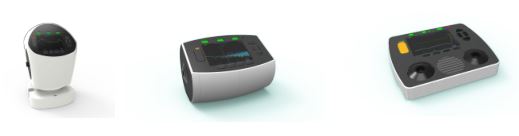
ZUMI measurement instruments are integrated audio spectrum test and measurement tools for product development and mass production applications.
ZUMI instruments;
- produce frequency response and frequency spectrum measurements,
- calculate secondary data such as ANC curves, Channel Balance etc.
- apply pass/fail criteria to data
- execute sequences of measurements
ZUMI devices are built on the ARM Cortex processor performing data acquisition, audio related computation and execution of complex test and measurement sequences.
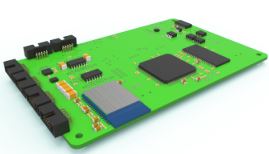 ZUMI instruments package all measurement hardware in a single unit including output amplifiers, channel switching, microphones, input channels, Bluetooth source, communications interfaces and user interface.
The instruments’ measurement functions are based on executing pre-configured sequences of data acquisition, analysis and interaction with DUT’s.
The system design is primarily aimed at fixed purpose test setups and is delivered in use case specific packages. The concept largely eliminates the need for user training as it is operates on a single button press principal.
Applications
- IQC, Production and OQC audio product testing
- Active Noise Cancellation Headphones and Earphones
- TWS Bluetooth Earphone Testing
- Audio filter electronics quality control
- Driver IQC and production binning
- Digital EQ tuning
Quick Start
The following shows the basic method of operation for a headphone test.

Connect Power

ZUMI operates a from 5V micro USB supply. The power supply can be delivered from a USB Host (the system enumerates for USB full power), a USB wall charger or power bank. ZUMI incorporates a Li Po battery charge controller that supports the use of internal batteries (*shipping restrictions on these battery do however limit availability).
Power Up

To power-on the device press the power on/off button when in a powered-off state. To power-off the device press the power on/off button when in a powered on state.
Power kill occurs when the device is in the powered on state and the power on/off button is held down for ~2 seconds
Load Headphone
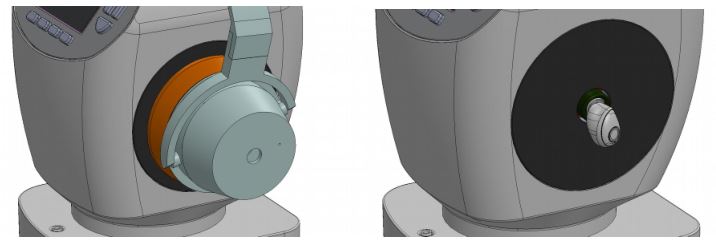
Place the DUT on the instrument and connect cables as required. Note ANC products with Bluetooth audio and system interfacing with Bluetooth SPP will not require any physical connections.
When powered on the system boots, this process starts all systems peripherals and loads the stored measurement profile from EEPROM. If no measurement profile has been stored (e.g. first use) the default profile is set.
Measurement Start

Pressing the start/stop button when the system is idle will start a measurement. The measurement will start on button release. The start/stop button LED backlight will be lit to indicate the measurement is in progress. The measurement process will execute without the need for any further user input
Check Result
The pass or fail status of the product tested will be indicated by Pass/Fail LED lights
Test Next
Load the next headphone and press the start button to measure and trim the next product
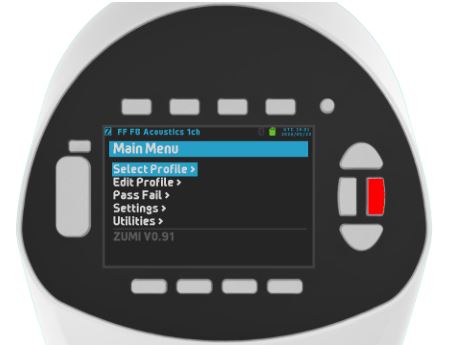
Select Test Profile
From the graph screen press the enter button to enter the menu tree
From the root menu choose Select Profile
Choose a pre-built profile using the up and down buttons to highlight the required profile, or choose load from SD …
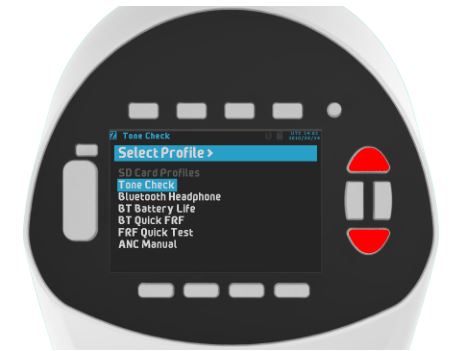
Highlight the required test profile and press the enter button to load it

The test profile will be loaded and the display with return to the graph display, ready for a test to begin.
Principals
ZUMI systems principal of operation is based around executing a sequence of test items.
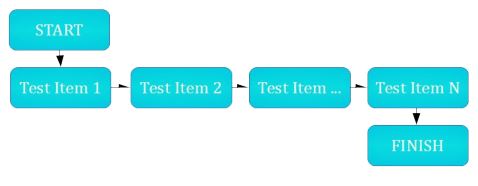
Each test item consists of
- pre – actions
- measurements
- calculations
- pass / fail checking
- post – actions
- flow control

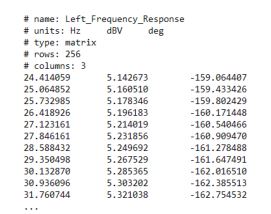
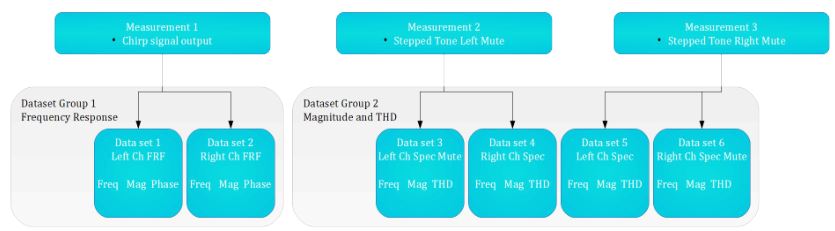
A measurement results in one or more Datasets. A Dataset is a matrix of data for example frequency, magnitude and phase data points of a frequency response.
Datasets are grouped into Dataset Groups. A Dataset Group identifies a collection of datasets that are to be displayed together on a graph, have the same pass / fail criteria applied and/or determine the behaviour of an action. For example the Dataset Group ‘Frequency Response’ may contain the datasets ‘Left Channel’ and ‘Right Channel’ then a pass/fail bound criteria assigned to the Dataset Group ‘Frequency Response’ will apply to all the datasets contained in that group.
Actions define an activity that must be performed before a measurement begins or in response to a measurement. For example the action ‘Connect Bluetooth A2DP’ instructs the system to find a bluetooth device and establish an A2DP connection before the measurement begins. Typical actions include;
- Wait for user input
- Connect to a bluetooth device
- Set or Get data via I2C, UART, SPI, SPP
- Adjust output level to get a specified input level
- Adjust ANC device mic gain
- Repeat until a pass condition
- Repeat until a fail condition
Additional actions can be added based on a users requirements
Calculations define computation and analysis to be performed on datasets to generate a resulting dataset. Examples of calculations are determine channel balance, determine polarity, compute ANC curves and parameters, complex number mathematics and computation of feedforward ANC system ideal filters. Calculations may use datasets from the current test item or previous test items.
Pass Fail Criteria are used to test data for conformity with a specified set of conditions. The most common of these conditions is the bound curves. At the completion of a test sequence the condition of each pass fail test is checked to generate an overall pass fail result.
A test item may be repeated until a pass fail or other criteria is met at which point the system proceeds to the next test item.
When all test items are complete the sequence finishes. The user may trigger a continuous run mode whereby the test sequence restarts automatically.
Example: Bluetooth headset test
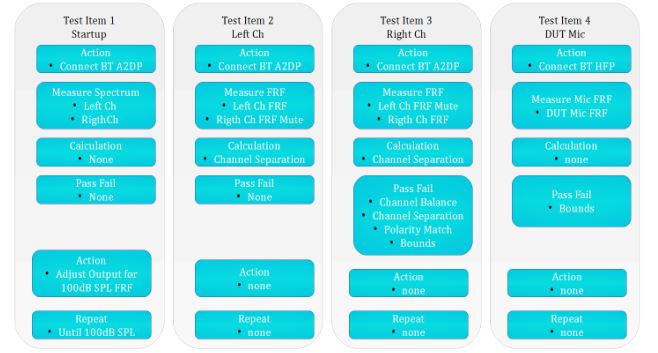
In this example the first test item ‘Startup’ begins by establishing an A2DP bluetooth connection to the DUT, once the connection is complete a measurement is obtained for Left and Right channels. This test item then performs the action of adjusting the output voltage so that the measured Left and Right channels will have a level of 100dB SPL. The measurement is repeated if further adjustment is needed, otherwise the sequence proceeds to the next test item.
Test Item 2 ‘ Left Ch’ makes a measurement of Left and Right channel with the Right channel output muted. Next the measured data is used in a calculation for channel separation.
Test Item 3 ‘ Right Ch’ again measures Left and Right channel, however the left channel output is muted. The Channel Separation is then calculated. Pass Fail criteria are then applied to the data measured and calculated from Test Item 2 and 3.
Test Item 4 begins by connecting to the DUT with the HFP protocol. A measurement is obtained for the DUT microphone. The measured data is then subject to a bounds type pass fail criteria.
Measurements
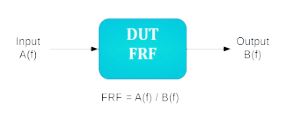
A measurement consists of generating an output signal, sampling an input signal and processing those signals to yield a resulting data set. The signals are processed to produce either;
- a frequency power spectrum or
- a frequency response function.

The frequency power spectrum is derived from the FFT of an input signals’ sampled data.The frequency response function is derived from two input signals’ sampled data where the signals represent the input and output from a system under test.
The type of result generated depends on the measurement signal used and the number of signals defined.
When a single input signal is defined the result is always a frequency power spectrum. If the output signal is tone based, i.e. a fixed tone or stepped tone, the total harmonic distortion will also be calculated by default. For non-tone based signals, i.e. the chirp and pink noise the THD cannot be derived and only the magnitude data is available.
When two signals are defined the result is always a frequency response function in terms of magnitude and phase.
The following table shows the available output signals and the associated parameters. Any parameters that are not given a specific value will be given the default value shown in the table.

The process of generating a result dataset is called an acquisition. Acquisitions may consist of one or two input signals. One input signal leads to a frequency power spectrum and two input signals leads to a frequency response function.
The following table shows the type of data resulting from each combination of output signal and acquisition. In the table the use of ‘INA’ means one signal has been specified and ‘INA/INB’ means two signals have been specified.

Example: Fixed Tone Spectrum
[Test A]stimulus = fixedtonefrequency = 1000Hzacquisition = IN1, IN1 Spectrum, Power Spectrumacquisition = IN2, IN2 Spectrum, Power Spectrum
This configuration will output a 1kHz tone and sample data on IN1 and IN2 channels. The sampled data will be used to compute the Power Spectrum and the resulting data put into datasets named IN1 Spectrum and IN2 Spectrum. The two datasets will be displayed on a graph called Power Spectrum.
Example Frequency Response
[Test B]stimulus = chirpacquisition = IN1/OUT1, IN1 FRF, Frequency Responseacquisition = IN2/OUT2, IN2 FRF, Frequency Response
This configuration will output a chirp signal and sample data from IN1,IN2,OUT1 and OUT2 channels. The sampled data will be used to compute the frequency response function IN1/OUT1 and IN2/OUT2.
A measurement signal assigned to a subsequent test item will be linked. This is done to guarantee that the signals used for two or more test items are identical and remain identical for any changes made to the signal setup. This is done for measurements that depend on having an identical signal in different test items to generate sensible data. The ‘linking’ of a measurement setup is done by specifying the ‘link’ key with the source test item as the value
Example: Linked Measurement Signals[Test 1]stimulus = chirpstartfreq = 1Hzstopfreq = 10000Hzacquisition = IN1, IN1 Spectrum, Power Spectrum[Test 2]link = Test 1acquisition = IN2,IN2 Spectrum, Power Spectrum
In this example the key-value pair link = Test 1 in the definitions for [Test 2] causes all the measurement parameters from Test 1 to be used for Test 2
ZUMI provides the following types of output signal;
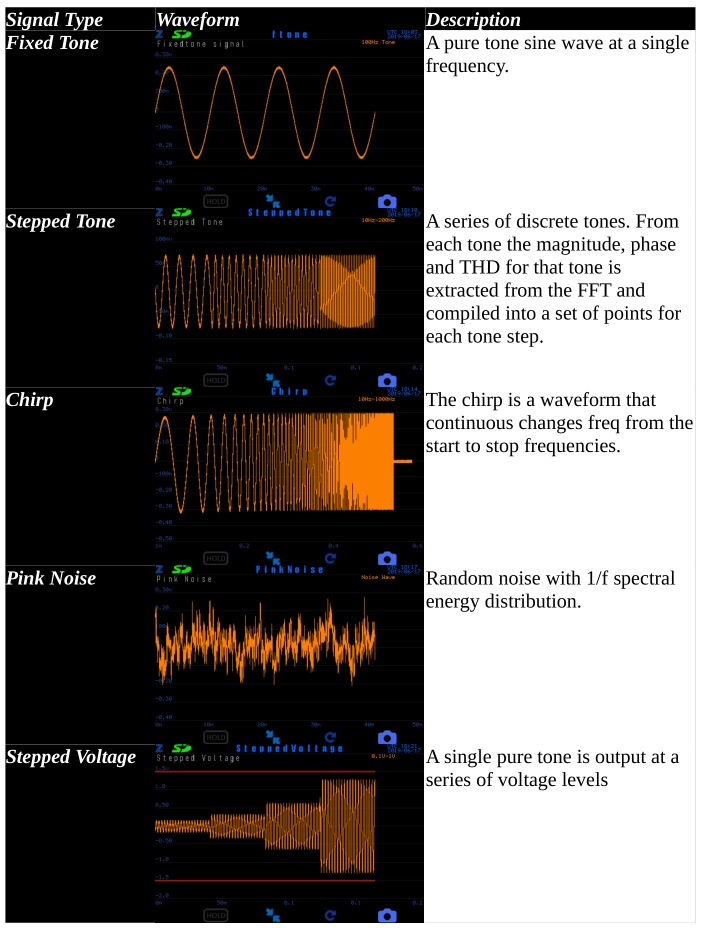
The choice of output signal depends on the purpose of the measurement. The most commonly used signal is the chirp.
The output voltage may be specified independently of the measurement signal. The configuration file uses the line below to specify the output voltage
outputvoltage = 0.3VrmsThe output voltage is always and only given in terms of Vrms.If the output voltage is not given it will default to 0.05VrmsIf the output voltage is not given and the measurement is linked the output voltage will assume the valued of the linked from test item.
The maximum output voltage is 1V rms.The minimum output voltage is 0.001Vrms, it is however recommended to use at least 0.01Vrms output level when possible.
The output amplifier has 64 discrete output voltage steps. When an output voltage is specified the actual output voltage will be the step closest to the specified value.
The output is dual mono. This means the same signal and voltage is output on two channels. The channels can be independently muted but cannot carry differing voltages or signals.
The output channel mute is specified with the following lineoutputmute = left (or right)This will mute the left channel.
The output channel can also be specified independently of the measurement signalThe possible output channels are;
- Headphone
- External
- Bluetooth
- None
The configuration line to specify the output channel is;
outputchannel = headphone
the default output if nothing is specified it headphone
If the measurement signal is linked and no output channel is specified it will default to the same as that linked from test item.
Only one channel can be used at one time.
Acquisition
An acquisition refers to the definitions for which input signals should be ued in a measurement and how the data should be arranged.
An acquisition definition contains the following parts;
- input signal(s)
- dataset name
- group name
- options
The ini file configuration line ;
acquisition = OUTL , Left Output , Spectrum
will specify that the OUTL channel is measured with the resulting data placed in a dataset name ‘Left Output’. The dataset is included in a group named ‘Spectrum” and will be display on a plot with the same name.
A line
acquisition = MICL / OUTL , FRFL , Frequency Response
will create a datatset called FRFL, the dataset will hold the frequency response data derived from MICL divided by OUTL. The group and graph display name will be Frequency Response.
One or two input signals may be given. In the case of two input signals the resulting data becomes the ‘output / input’ frequency response function.
Acquisitions can be created, edited and deleted using the built in menu system. In this case there is no facility to enter custom names, only the default assigned names for dataset and group are used.
Within the menu system an acquisition can be marked as inactive. When inactive the dataset is no populated and is hidden from graphs. All dependent downstream datasets are also disabled. When the state is returned to active all downstream effects are removed.
The dataset name is given by the user and can be any name. Leading and trailing whitespace from the name removed, internal white space is preserved. However in logged data internal white space is replaced by the underscore character.
The group name tells the system to group datasets together and display on a single graph. The group name is given by the user and can be any name. In order to display multiple datasets on a single graph (e.g. Left and Right channel measurements) the same group name should be used.
If datatset are given the same group name but have dissimilar units (e.g. one data with SPL, and one with dBV). A new group, with a default name will be create and the conflicting dataset assigned to this newly created group.
Options are keywords that instruct the system on various additional aspects of an acquisitions. The available options are;
denormalise, this option is effective when two input signals have been specified and a frequency response function is computed. The frequency response function by default gives data normlised to per unit ‘input’ signal. The use of denormalise rescales the frequency response function to actual ‘input’ signal RMS level, thereby undoing the normalisation of the frequency response function.
time domain, this option specifies that the acquisition will only display the time domain data acquired. If two signal names are given only the first is used and the second is ignored. Please note time domain data may contain a huge number of data points and be very slow display.
log time domain, this option specifies that the time domain data should be written to the log file. This is generally used only for specific anaylsis purposes as the time domain data may contained a huge number of points and thereby generate very large data files that are slow to write.
Calculations
Calculations are a secondary computation done on datasets to produce a new resulting dataset.
The avialable calculations are;
- Channel Balance
- ANC
- Ideal Feedforward Filter
- Complex Divide
Channel Balance
Channel balance calculates the difference between two datasets, presumably a left and right channel pair. The resulting data is a magnitude curve of the difference and a single value for the mean difference.
e.g.acquisition = MicL/OutL , FRL , Frequency Responseacquisition = MicR/OutR, FRR , Frequency Responsecalc = ChannelBalance , FRL / FRR , L – R Balance, Channel Balance
ANC
ANC calculates an active noise cancellation curve. The calculation expects an ANC off state dataset and an ANC on state dataset.In addition to the ANC curve the following ANC metrics are also computedPeak valuePeak freqUpper Zero crossLow zero cross
Upper overshoot maxLower overshoot maxArea under the curveMean ANC (depricated, this metric will be discontinued)e.g.[passive]…acquisition = MicL, PNL , Noise Spectrumsacquisition = MicR, PNR , Noise Spectrums[active]…acquisition = MicL, ANL , Noise Spectrumsacquisition = MicR, ANR , Noise Spectrumscalc = ANR , ANL / PNL , ANRL, Noise Reductioncalc = ANR , ANR / PNR , ANRR, Noise Reduction
Ideal Feedforward Filter
This calculation computes the ideal feedforward filter given a housing response and driver response as datasets.

The user must ensure the measurements for driver response and housing response have linked signals so that the resulting data is meaningful.
e.g.[Headphone]…acquisition = IN1/out1,PFRL,HP Responseacquisition = IN2/out2,PFRR,HP Response[FeedForward]…acquisition = in1/in3,HFRL,Housing Responseacquisition = in2/in4,HFRR,Housing Responsecalc = FF,HFRL/PFRL,FFIdealL,FF Ideal Filtercalc = FF,HFRR/PFRR,FFIdealR,FF Ideal Filter
Complex Divide
Computes a result dataset that is the complex division of two input datasets. If only one input dataset is given the calculation is discarded.
e.g.calc = ComplexDiv, DSAL/DSBL, CDIVLcalc = ComplexDiv, DSAR/DSBR, CDIVR
Actions
Action may occur before or after a measurement.Pre -Actions are a process that must be completed before the measurement process proceeds.Post-Actions are a process that must be completed before the test process moves to the next test item.An action is defined with linesaction = ActionName, Action specific parameters, …
When the system is waiting for an action to complete, such as connecting to a bluetooth device, the waiting state is indicated by Start/Stop button LED light flashing. The user can cancel any pending actions and continue the testing process by pressing the Start/Stop button.
The available actions are;
- Bluetooth
- AMS
- I2C
- LoopUntilFail
- LoopUntilUser
- LoopUntilPass
- AutoSetLevel
- CalOutputVoltage (special action for system self calibration)
Bluetooth
The bluetooth action establishes a bluetooth connection. The testing process will wait until a bluetooth connection is established before proceeding. There is no limit to the time the system will wait for a connection. The bluetooth module will continuously perform an INQUIRY to find a valid target device.
A typical configuration line is;preaction = bluetooth, HFP
This will cause the system to attempt to connect to a device using the HFP protocolThe available connection protocols are
- A2DP
- HFP (always opens an SCO channel)
- SPP
NOTE: selecting a bluetooth action does not automatically mean the output signal will be routed to the bluetooth module. The user must explicitly specify the output channel as the bluetooth module.
The bluetooth action line takes an additional parameter that is connection completed delay time.The delay time must be given in seconds and include the letter ‘s’ i.e.
action = bluetooth, A2DP, 3s
This line will define the delay time as 3 seconds.
The delay time will cause the bluetooth system to wait that period of time before allowing the test process to continue after a new bluetooth connection is established.
This delay time is intended to allow the bluetooth DUT to complete any voice prompt message or connection jingle before the measurement starts.
The delay time is ignored if a device is already connected. It is only relevant when a new connection has been established.
AMS
The AMS action is specific to the AMS active noise cancellation chips. The action configures the chip parameters through I2C and perform automatic gain adjustment for production mic gain trimming
The AMS chip is controlled with the following mode;
- init
- setregs
- autogain
Init
The init mode begins by performing the LOAD operation. The complete register list is then read out. The chip is then programmed with the reg , val pairs. Whenever the register 0x30 or 0x31 are specified the system identifies these as left and right microphone gain. The system determines the actual mic gain register to use based on the lock state of the microphone registers.
action = ams,init, reg1 ,val1, reg2, val2, …
Setregs
The set regs mode programs the AMS with the specified register and value pairs. As with the init mode the mic gain registers should always be specified as 0x30 and 0x31.
action = ams,setregs, reg1 ,val1, reg2, val2, …
Autogain
The auto gain mode will determine the gain change required to meet the ANC criteria assigned to the ANC data.
action = ams,autogain,ANCLeft,0x30,ANCRight,0x31
The arguments to the autogain mode are pairs of dataset and mic register. This defines the dataset that corresponds to the mic gain register.
In this example ANCLeft is the dataset name for the left channel ANC, it is know that the AMS chip Left mic gain register will control the ANC level of the dataset ANCLeft. We use the mic register address 0x30 to define the target mic gain register. If the 0x30 register has already been fused the system will automatically find the next available mic gain register.
LoopUntilFail
The loop unitl fail repeats a test item until a count of fail results has been reached. The parameters a datasetgroup name and a count of consecquetive failures. Both parameters are optional. Loop until fail is used primarily for testing battery life, where a test repeats until the battery is empty causing the test to find a fail result.
action = loopuntilfail
If the dataset group name is specified the fail condition is derived from only that dataset groupIf the dataset group is not specified any fail condition is countedIf the count of failures is supplied that number of consecutive failures is required before the repeat stopsIf the count of failures is not supplied the default value of 10 is used
LoopUntilUser
This action repeats the test item until the user the user presses the start/stop button. No arguments are used for this action
action = loopuntiluser
LoopUntilPass
This action loops a measurement until a pass condition is found. This action type is used to allow a measurement to repeat until the DUT has finished a power up sequence or bluetooth connection sequence.
action = loopuntilpass, targetDSG, passcount
The user should specify the datasetgroup for which the pass result is required and number of consecutive passes required to complete the action.
AutoSetLevel
This action changes the output voltage in order to achieve a desired input level. The action assumes firstly that the output voltage is controlling the input level and that the input level is directly proportional to the output voltage.
The parameters are a target datasetgroup and the required level.
action = autosetlevel , targetDSG , 100dB
This action is typically used allow for measurement at a consistent SPL level when DUT may have an unknown volume setting state. This is particularly applicable to bluetooth headphones where the device may or may not have volume control and the volume control setting is unknown.
Pass Fail
Pass Fail criteria are used to determine if a DUT meets a prescribed set of requirements.
The available pass fail criteria are
- Bounds
- ANR
- Separation
- Channel Balance
- Polarity
- THD
Bounds
Bounds define an acceptable region for measured data curves in pass fail checking. In general there is an upper bound and lower bound. The measured data must stay completely below the upper bound and completely above the lower bound to be determined to pass.

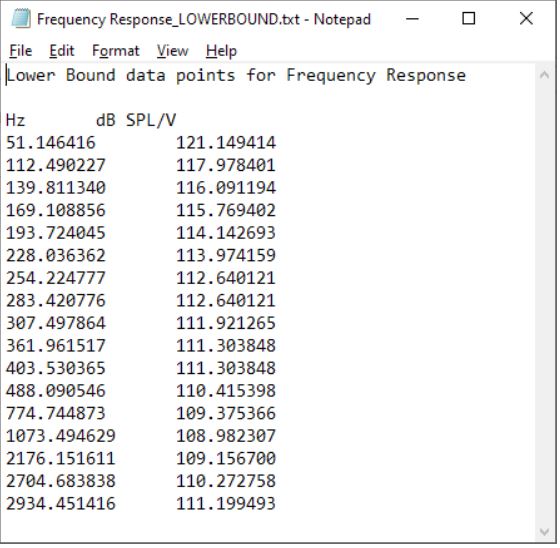
Bounds are stored as a series of frequency points and dB magnitude values. The frequency range of bounds can extend beyond the measured data or be less than the measured data points, however bounds require at least 2 points.
Bounds are associated with a datasetgroup and all measured data displayed on that datasetgroup are tested against the bounds
The configuration instruction for bounds can be as followscriteria = bounds , Frequency Responsewhere;“Frequency Response” is the name of a graph (or set of measured data)The above instruction provides no information about the bounds except that the named measured data group (graph) shall have a bounds criteria associated with it. In this case the bounds default to 50Hz – 5kHz +/-3dBIf the datasetgroup name is ommitted the system will attempt to find a valid datasetgroup to apply the bound to.Bounds cannot be applied to data derived from fixed tone signals and cannot be applied to time domain data.Bounds data has a maximum length of 2048 points.
The actual bounds freq and value points can be defined in the following ways;
- Freq Val pairs written in a TXT file
- Generated from a measured dataset
TXT File Specified Bounds
An ini configuration file specifies the txt files containing bounds data by including the files names in the bounds definition line i.e.
criteria = bounds, Frequency Response, FR_UpperBound.txt, FR_LowerBound.txt
The bounds files names must have ‘ upper’ and ‘lower’ somewhere in the file name and have the suffix ‘.txt’. The system is case insensitive. The remainder of the file name is completely optional although its good practice to indicate the datasetgroup name and use the string ‘bound’ in the filenames. Do not include the file path, the system will search the SD for the named files.
When the system generates bounds files the filename follows the format;[datasetgroup name]_LOWERBOUND.txt[datasetgroup name]_UPPERBOUND.txt
The files will be stored in the test config folder as;[Test Config Name]\Bounds\[datasetgroup name]_LOWERBOUND.txt[Test Config Name]\Bounds\[datasetgroup name]_UPPERBOUND.txt
Upper and Lower bounds data are stored in separate txt files;
THD
The THD criteria sets a maximum limit for the THD computed for a dataset. THD can only be computed from datasets that are derived for a tone signal, either a fixed tone or a stepped tone.The THD is specified by naming a dataset group and supplied a maximum THD value in percente.g.criteria = THD, Tone Spectrum, 5%
If no THD value is supplied a default value of 5% is used
For Stepped Tone measurements two additional arguments are accepted, start frequency and stop frequency.e.g.criteria = THD, Stepped Tone Group, 5%, 200Hz, 2000Hz
If a stepped tone measurement is used and the start and stop frequencies are not specified, 200Hz to 2000Hz is used.
Polarity
The polarity criteria requires that all datasets in a group have the same polarity. The polarity check works by looking at the phase response over a specified range and checking if the phase difference exceeds 90 degrees.
The polartiy criteria is specified by namng a dataset group and optinally supplying a start and stop frequency for the relevant rangee.g.crtieria = Polarity , Headphone Response, 100Hz, 400Hz
Channel Balance
The channel balance criteria takes the mean magnitude of a channel balance difference dataset across a specified frequency range and determines if the mean exceeds the specified limit.The channel balance is specified by naming a dataset group and specifying a maximum +/- limit for the mean.e.g.criteria = ChannelBalance, LeftRight Balance, 3 , 100Hz, 2000Hz
If the +/- limit, start frequency and stop frequency are omitted the defaults 3dB, 200Hz and 2000Hz are used
ANC
For ANC measurements the pass fail criteria are used to determine if a DUT’s ANC performance has meet the predetermined requirement. The criteria for ANC performance can include some or all of the following points;
- Low freq zero cross maximum
- high freq zero cross minimum
- Low freq overshoot maximum
- High freq overshoot maximum
- ANC peak target
- ANC peak tolerance
- ANC Average target
- ANC Average tolerance
- Channel difference maximum
- Bandwidth minimum
The ANC criteria are also use to compute the required ANC chipset adjustments when used for production line trimming
Bounds
Bounds are a type of pass-fail criteria applied to any dataset. Most commonly bounds are used to set an upper and lower limit on a frequency response curve to check conformity with a specified curve shape and level.
Bounds are realised as a set of frequency points and magnitude points, one set for lower bounds and one set for upper bounds e.g.
Bounds do not include phase data, if the phase data is provided it is ignored.Bounds are associated with a dataset group and all datasets within that group are tested against the bounds.
Bounds can be created from a current measurement by using the instructionMain Menu -> PassFail -> Bounds-[Target Datasetgroup] -> Set Bounds from Current Data or serial command
PF Set Bounds From Data, datasetgroup(if dataset group is omitted all bounds type pass fails will be set)The argument datasetgroup can be the datasetgroup string name or the numerical index.
When booting the system, if bounds are stored in the EEPROM , those bounds will be loaded and used.
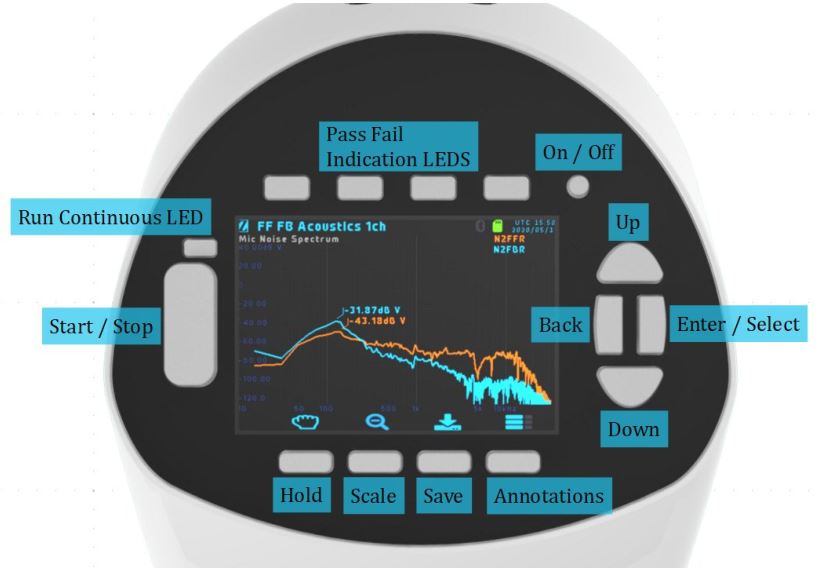
User Interface
The ZUMI user interface consists of an LCD display, buttons and indicator LED lights.
Power On/Off
Powers the system on or off. Press and hold for for 3 seconds for forced shutdown.
Start/Stop
When the system is idle press and release the start stop button to begin the measurement sequence.When the system is idle press and hold the start stop button for 2 seconds to set continuous measurement mode. The run continuous LED will illuminate when this mode has been triggered.Release the button to start the measurement.When a measurement is in progress press and release the start stop button to terminate the measurement sequenceWhen the system is waiting for user input or pending a peripheral action (e.g. waiting for a Bluetooth connection) press and release the start stop button to skip waiting and continue the measurement sequence regardless of the pending action statusWhen the system is in a repeat loop (e.g. Auto tuning an ANC headphone microphone gain) press and release the start stop button to exit the loop and continue with the measurement.
Previous Graph / Up
When displaying graph data pressing this button will change the graph page to the previous graph. In many use cases a measurement sequence will consist of several pages of data displayed in graphical format. If the measurement setup has only one graph page pressing this button will have no effectWhen displaying the menu system pressing this button will move the selected menu item up.
Next Graph / Down
When displaying graph data pressing this button will change the graph page to the next graph. In many use cases a measurement sequence will consist of several pages of data displayed in graphical format. If the measurement setup has only one graph page pressing this button will have no effectWhen displaying the menu system pressing this button will move the selected menu item down.
Enter/Select
When displaying graph data pressing this button will enter the menu system at the top level.When displaying the menu system pressing this button will action the currently selected menu item. If the menu item is submenu heading the submenu will be entered and displayed. If the menu item is a system action the action will be performed
Back
When displaying graph data pressing this button has no effect.When displaying the menu system pressing this button will move to the parent menu display.From the root menu pressing this button will exit the menu system and display the graph page.
Hold On/Off
Pressing this button will toggle the display of hold curve data displayed on the graph. If the hold data display is disabled, pressing this button will capture the currently displayed data and display it as the hole curve data.
Autoscale
Pressing this button forces the graph display axes to be rescaled to fit all measured data.
Refresh
Pressing this button forces to the system to completely redraw the graph data.
Save Image
pressing this button will cause the system to save all graph pages as BMP image files to the SD card. If no SD card is available pressing this button has no effect
Pass / Fail LEDs
Indicate the measurement data passed or failed the applied criteria. LEDs light green when passed and red when failed.If the measurement process has no pass/fail criteria defined the LEDs remain unlit
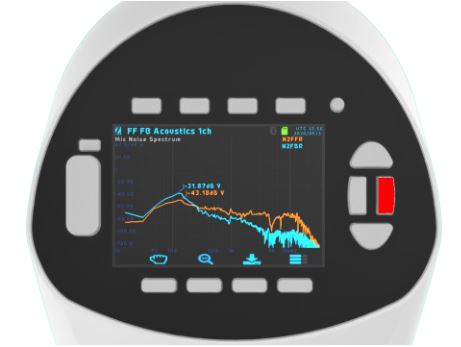
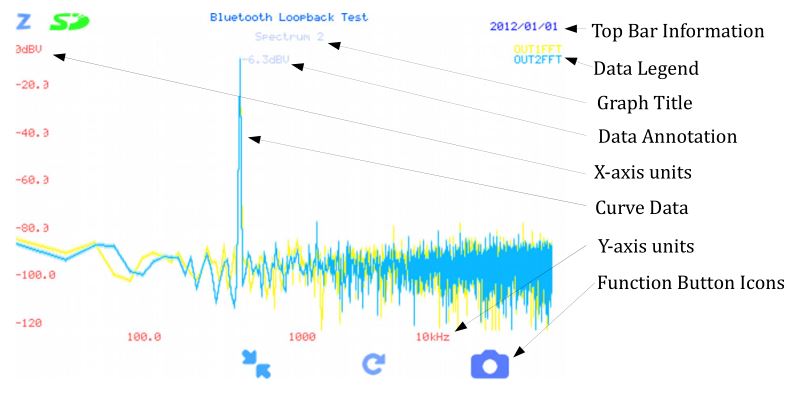
Graph Display
The graph display presents measured data curves such as the Frequency Spectrum, FrequencyResponse Function, ANC Curve and Time Domain Data.
The menu system allows the user to interact with the ZUMI instrument to perform a variety of tasks. The menu system is arranged as a tree menu. The Enter, Back, Up and Down buttons are used to navigate the menu system.

Select Profile
Select profile allow the user to choose a test profile. Each implementation of the test instrument comes pre loaded with appropriate test configuration. The user can also load configurations from an SD card.
Edit Profile
The edit profile menu tree allows the user to modify the configuration parameters of the current loaded test configuration. The changes made will be stored when the user exits the menu
Settings
The setting menu provides access to various system settings.

Logging control the setup for data logging.Pass Fail provides settings for enabling / disabling pass fail checkingUnwrap Phase switches on or off phase wrapping. Note phase unwrapping my give undesireable results when dealing with noisy dataRunning Mean, The system computes a mean of all data on each graph.Continuous Mean, When active the running mean is rolled over indefinitely , when disabled the running mean stops after accumulating 25 averagesBlock On Acq, halts all system activities during data acquisition, this can reduce digital noise however is rarely usedShow YB Axis enables or disables the display of the secondary Y axis. This would be phase or THD dataDisable Remap. Normally the system remaps spectrum data to 500 points in order to reduce the data files size for logging. This behaviour can be disabled by setting this option.
Utilities
The Utilities menu provide user access to system based function.
LCD allow dimming of the LCD display and LED pass and fail lights.SD Card Allows storing test configuration to an SD card. This would be used generally to duplicate a configuration
Amplifier Controls Provide access to some amplifier functions directly.Bluetooth allow the user to activate and deactivate the bluetooth module as well as make it visible for connection with smartphone or PC for serial communicationsI2C utilities offers a bus scan functionAMS ANC allows the user to READ,LOAD and BURN an AMS ANC chip that is connected on the I2C busSystem allows the user to perform a complete system factory reset.
Bluetooth
ZUMI includes a Bluetooth module that acts as
- A2DP source (SBC encoding standard, aptX and ACC optional)
- AVRCP target
- HFP audio gateway (v1.6)
- SPP (serial port interface)
The Bluetooth module is used to output to and receive measurement signals from a DUT, send and receive commands with a DUT and provide a serial interface an Android device or PC.
Configuration
In a configuration ini file an example instruction to use bluetooth is as follows
outputchannel = bluetoothaction = bluetooth , connect A2DP , delay 3s , volume 100
outputchannel specifies the output test signal shall be routed to the bluetooth module.action = bluetooth specifies the system shall establish a bluetooth connection before the measurement proceeds.
the argument connect A2DP instruction the system to establish an A2DP connection. This argument can also take the values;
- connect A2DP
- connect HFP
- connect SPP
- connect loopback
if no argument is given e.g.action = bluetoothor the argument is not recognised e.g.action = bluetooth, unrecognisedthe system defaults to connect a2dp
the argument ‘delay 3s’ specifies 3 seconds delay time after a connection is established. If not given a default 0.5 seconds delay is applied
The argument volume 100 specifies the DUT volume setting as a percentage. The system will instruct the DUT to set this volume level upon connection. If volume is not specifies the default 100 is applied.
If the output channel is defined as bluetooth and no bluetooth action is given the system automatically inserts an A2DP. The action is considered temporary and is discarded if the output channel is changed to something other than bluetooth.
It is quite possible to specify a Bluetooth connection and use a different output channel, in which case the system would wait for a Bluetooth connection and then begin a measurement using, say, an analogue socket output.
Auto-connection
Test configurations that include the use of a Bluetooth connection flag the system to begin searching for available Bluetooth target devices. The devices that are deemed valid targets are limited by a class of device mask, minimum RSSI and optionally a MAC address range.
The Default limits are;Class Of Device Mask 0x200400RSSI Minimum -60dBMAC Address Mask -none
The system maintains a record of the available candidate devices. Devices are recorded as candidates when they respond to a Bluetooth INQUIRY and meet the conditions of a valid target.Devices are removed from the candidate list if they do not respond to an INQUIRY.
A device must be in pairing mode to respond to an INQUIRY and be recognised. When a connection is terminated the paring information is deleted. No attempt is made to connect to a previously paired device.
When the test sequence requires a Bluetooth connection the best candidate device is called and the connection established. The best candidate device is determined as the device with the highest RSSI level. Should no device be available the system will wait while it continuously searches for a candidate.
In order to avoid having the system connect to a device that is not the desired DUT it is recommended to keep other devices at a distance of greater than 1 meter and where possible disable pairing mode. Additionally the user can modify the RSSI limit
When a connection has been established the system ceases to search for candidate devices.
When a measurement sequence completes all active Bluetooth connections are terminated. If however the system has been set to run continuous connections will not be terminated while the measurement sequence repeats.
Many devices have a voice prompt when a connection is established, in order to avoid the voice prompt interfering with a measurement signal a delay can be applied between the time a connection is established and the time the measurement signal begins. In order to optimise the measurement time the user should specify the minimum delay time in the test configuration.
Serial Interface
A serial interface can be established between ZUMI and an Android device or PC. The serial interface uses Bluetooth SPP.To establish a SPP connection the Bluetooth module must be set to Visible. The Android or PC should then initiate a pairing and establish an RFCOMM connection.The serial interface over Bluetooth operates the same as a USB serial connection. i.e. it behaves as a com port.By default ZUMI is not Visible and does not answer calls. The user must specifically set Visible before establishing a new connection or reopening an existing connection.ZUMI will be visible for 60seconds after booting, and will remain visible for 60seconds after the user sets visible state.
Output Signals
ZUMI provides 2 wired outputs (Left and Right channels each) and a Bluetooth audio source.The output path is switched internally and only one path can be active at one time. Each path has left and right channels.The wired outputs provide a maximum of 1.06Vrms (1.5Vpk / 3Vpk-pk) and 100mW output power. 2 wired paths are provided with the typical use case being one path for the DUT left and right and the other path for external speakers left and right.The Bluetooth transmitter acts as an A2DP source and HFP-AG for audio purposes.The available output signals are;
- Sinusoidal tones
- Chirp
- Pink Noise
- White Noise
- Arbitrary .WAV signal
Output signals are generated by the onboard DAC with sampling rate up 150kHz. The useful output frequency range is 1Hz – 40kHz.
The output voltage is specified for each test item with the key / value line
outputvoltage = [x Vrms]
if the output voltage is not specified the system uses a default value of 0.05Vrms
the 2 output channels cannot have different output voltages however channels can be independently muted. A channel mute state is set with the key / value lineoutputmute = 1,1the first argument specifies the OUT1 (Left) mute statethe second argument specifies the OUT2 (Right) mute state
if OUT1 mute and OUT2 mute flags are both not specified both are defaulted to not muted
if only the OUT1 mute state is specified and OUT2 mute is not given, OUT2 will be assigned the same state as OUT1
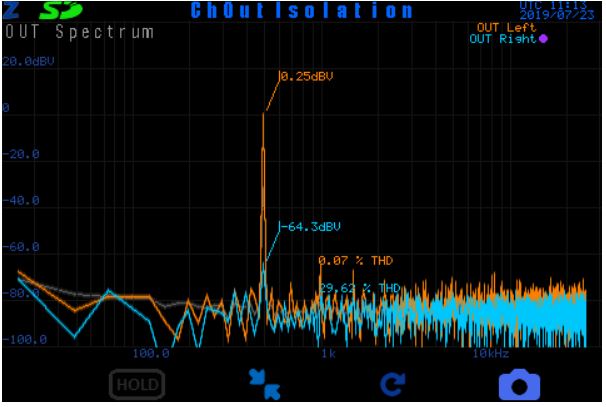
The purpose of mute is to allow measurements of cross talk and channel assignments.
The system inherent channel isolation is approx 65dB
Two headers are used to connect the wired output signals, each header carrying 2 channels.The headers are IDC 2x5pin 1.27mm pitch (50mil). Pin assignments are as shown below.

Output Amplifier
The wired signal output is driven by a headphone power amplifier capable of approximately 100mW and up to 1V rms.
The amplifier offers 64 gain steps to set the desired output voltage. Whenever a voltage level is specified the amplifier uses the nearest discrete step.
In normal operation the output voltage is set automatically in a measurement sequence based on the test profile value for ‘outputvoltage’, or the default value if not given.
The wired signal output is driven by a headphone power amplifier capable of approximately 100mW and up to 1V rms.The amplifier offers 64 gain steps to set the desired output voltage. Whenever a voltage level is specified the amplifier uses the nearest discrete step.In normal operation the output voltage is set automatically in a measurement sequence based on the test profile value for ‘outputvoltage’, or the default value if not given.outputvoltage = 0.5VrmsIt is possible to set an override for the output voltage so that it can be modified on the fly.The output override mode must be set with the commandAMP OUT OVERRIDE,1 ( or ,0 to disable the override)then the output voltage can be stepped up and down withAMP OUT UPandAMP OUT DOWNAlternatively an RMS voltage level can be specified directly withAMP OUT RMS, x (where x = the desired output votlage RMS value)The default and normal use output model is dual mono, singled ended channels. The output can also be set to bridged tied load. In this mode the output is psuedo differential with left and right output lines forming the positive and negative swings.The output mode is set with the commandAMP MODE, 0 (or 1 or 2)where 0 = Stereo mode (dont use), 1 = Dual Mono (default), 2 = BTL
Input Signals
ZUMI includes 6 single ended input channels (please inquire if additional channels are needed). 2 channels are hard wired as output sense (OUT1 , OUT2).The remaining 4 channels (IN1, IN2, IN3, IN4) are AC coupled to an input buffer. The input buffer has a maximum 1.5Vpk (3Vpk-pk)signal input range and -5V – +5V common mode voltage range.Two headers are used to connect the input signals, each header carrying 2 channels as well as 3.3V, 5V and Ground supply rails.The headers are IDC 2x5pin 1.27mm pitch (50mil). Pin assignments are as shown below.

Please note, the 3.3V supply rail has limited current supply capability. This supply is derived from the main board power supply. It is recommended to avoid using this supply under normal circumstances.
Input Output Identification
All input and output channels may be assigned a use case specific name, signal units and signal scaling.
The purpose of this is to allow consistent and readable test configurations to be used on ZUMI implementations that have different input and output connection setups.
For example it is usual for the channels IN1 and IN2 to be physically connected to the MicL and MicR. However a given implementation may use the channels IN3 and IN4. Rather than modify the configuration file, we can simply reassign the references for MicL and MicR.
In addition to the naming assignment we can also specify the signal units. Normally there is only Pascals and Volts (PS and V) however it is possible that other types of transducer are connected that use other units e.g. an accelerometer that measures mm/s2
Along with the units we can also specify the scaling. The scaling is given in terms of Volts / unit.For example a microphone with preamplifier may output 0.06295V/Pa
The default identification are as follows

If the base input signal ID is used the data is scaled to volts directly. An assigned name must be used for the scaling factor to be applied.e.g. acq = IN4,Input 4, Sectrumwill show the spectral data on channel 4 directly as volts (i.e. dBV rms)whereasacq = MicL,Mic Input, Spectrumwill show the data scaled appropriately and using the assign units i.e. dBSPL
The Identification, units and scaling are assigned by inclusion in a config ini file or by serial commands
SetInputSignal , {index} , {name} , {units} , {scaling}
Interfaces
Interaction with external devices or DUT is available through a range of industry standard protocols. The typical use cases are to set the DUT mode for testing, configure DUT registers for ANC trimming and/or DSP equalisation and signalling assembly line control systems for product flow.
The available protocols are;
- I2C
- UART
- SPI
- QSPI
- Bluetooth SPP
- GPIO
Two headers are used for interfacing. The headers are IDC 2x5pin 1.27mm pitch (50mil). Pin assignments are as shown below.

SD Card
ZUMI has an integrated SD Card reader. The SD Card interface is used to
- store measurement log data
- store graph images
- store configurations held in the internal EEPROM
- load measurement configurations
- load bound curve data
- load reference curve data.
ZUMI uses full sized SD Cards. The maximum card capacity supported is 2TB
ZUMI supports ONLY FAT, FAT32 and exFAT file systems on the SD card. The SD card will not be recognised (appear as “No Card”) for SD cards formatted with NTFS or other filesystems. In this case please use a PC to format the card to FAT, FAT32 or exFAT. Note in windows FAT32 is usually the default format for SD cards.
The SD card system does not support Unicode characters.The maximum path and file name is 256 characters.The maximum number of configuration files is 128.On screen top bar displays the SD card status icon. The status is one of three states, no card available, card ok or card write protected or full.
![]()
On inserting the card;
- card is scanned for files with the *.ini suffix, all *.ini files are assumed to be ZUMI configuration files. The scan is limited to 3 directory levels deep. *.ini files deeper than this level will not be found and cannot be loaded.
- files with a leading underscore ‘_’ for the filename will be ignored
- card is scanned for the current configuration directory, if it is not found it will be created.
Real Time Clock
ZUMI includes a stand-alone real time clock IC for maintaining the date and time when there is no power supply. The real time clock uses a CR2032 battery to provide backup power supply to keep the clock running.
The date time is used to timestamp all log files written to the SD Card.
ZUMI instruments are factory set with UTC standard time. The purpose of using UTC time is to make the devices not dependent on locality.
The expected battery life is approximately 10Years
The date time can be set by serial command. The command string is; ‘set date time’ usage as shown below.
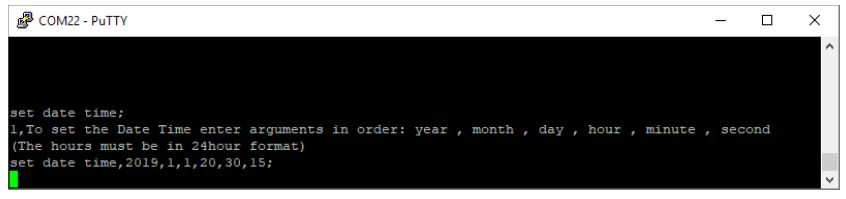
The above instruction sets the date time to 1st January 2019 10pm:30mins:15secs
Serial COM Port Interface
ZUMI implements a serial data command interface. Serial data can be transferred through the USB connector or via a Bluetooth SPP connection.The USB connector uses an FTDI UART to USB chip. When connected to a Windows(r) based PC the connection will enumerate as a COM Port.The COM Port number can be found in windows device manager listed as USB Serial Port (COMx)

The COM Port uses ASCII serial characters to communicate. Use a serial terminal software e.g. PuTTY to send and receive data.
The configuration for the serial interface is;Speed (baud):115200Data bits: 8Stop bits: 1Parity: NoneFlow Control: None
The bluetooth serial connection can be established by a PC or smartphone that support SPP connections. Apple iOS devices do not support the SPP protocol and cannot be used. In order to establish the Bluetooth connection ensure that the ZUMI Bluetooth module is activated. For first use the ZUMI Bluetooth module must be set to ‘Visible’ in order to create a pairing.
Serial commands can be sent as ASCII based messages or as framed data packages.The ASCII capability is only available for a subset of commands and is preserved primarily for ease of human interfacing with PuTTY or similar serial software.The framed data packages enable full access to commands and data. Framed data packages must be used to transmit binary data.
ZUMI outputs serial data in framed packages always.
The frame format is;START FLAG 0x02 1 ByteCMD CODE 0x?? 1 ByteLength 0x?? 0x?? 2 BytesData[Length] … Length BytesEND FLAG 0x03 1 Byte
In many case the framed package outputs will be human readable ASCII with the exception of CMD Code and LENGTH which may print as a character. The START and END flags are normally ignored as non-printable characters by serial terminal software.
Serial data handling Logic. When serial data is recieved ZUMI looks for either a printable character or the START FLAG. If a printable character is found the serial data is interpreted as ASCII commands. The parser then looks for the command terminator character ‘;’. When this character is found the message line is actioned. If a start flag is found the data is interpretted as a framed package, the parser then looks for the end flag in the position specified by START FLAG + 3 + LENGTH. When found the framed package is handled
If a ASCII message or framed package is started, ZUMI will wait aprooximately 2 seconds for more serial data to be received. If there is no more data the system will timeout and the existing message part is discarded and ZUMI resets to wait for a message start trigger.
If an ASCII message is started and a START FLAG is found, the existing ASCII message is discarded and the parser begins looking for the complete framed package.
If an ASCII message is started and the END FLAG is recieved ZUMI discards the ASCII data and reset to waiting for a start trigger.
If a framed package is started and the END FLAG does not occur in the correct position the frame is discarded.
This parsing logic does leave open the possibility for corrupt transmission causing an incorrect interpretation.
The serial interface uses a 32kByte circular buffer (32768 Bytes). Any transmission that exceeds this size will lead to data corruption.
Command lines are terminated with a semi colon character ‘;’The command parser will wait for a semi colon character before attempting to parse the incoming command string.Enter the command 0; to retrieve a list of all available commands.Any unknown command will cause the system to output the list of available commandsThe format for commands is as follows;
‘command name’,’arg1′, … ;
Commands may or may not require arguments.
EEPROM
ZUMI includes EEPROM memory to store configuration data, input channel correction data and pass fail bounds data.Whenever any of configuration data are modified the new data is stored in the EEPROM.On each boot the configuration is loaded from EEPROM only. Any changes made to configurations stored on the SD card are not automatically loaded, the user must specifically command ZUMI to load SD card configuration information.
All EEPROM data can be deleted with the command;EEPROM INVALIDATEor menu itemMain Menu > Utilities > System > Reset > Factory Reset
The correction data is a special case and is not deleted with this command. The correction data can be deleted with the commandEEPROM B INVALIDATEor menu itemMain Menu > Utilities > System > Reset > Erase Correction Data
Specifically the EEPROM stores
- System configuration
- Test configuration
- Input Channel configuration
- Pass Fail bounds data
- Correction Data
- Output Voltage Steps
System ConfigurationThe EEPROM holds a set of variables related to the system configuration. All variables are set by default. The configuration variables include the display colors, state variables for the various settings, system flags, device name and various other parameters.
Test ConfigurationThe EEPROM stores the complete test configuration last used. At each boot the test configuration is loaded from the EEPROM only. In order to load a test configuration from the SD card the user must use the menu system to instruction an alternative configuration to be loaded. If no test configuration has previously been loaded, or the EEPROM has been marked invalid, a hard coded default configuration will be used. The hard coded default configuration will be specific to the measurement instrument, i.e. a Bluetooth earphone test instrument will be hard coded with a default configuration for measuring Bluetooth earphones.
When a configuration load from SD card is completed successfully the configuration is stored in the EEPROM. On next system start this configuration is loaded. The previous configuration data is lost, unless the user has specifically given the command to store the test configuration to SD card. The EEPROM configuration will be used hence forth such that the SD card is no longer necessary.
Should pass fail bounds data be loaded from the SD card or generated from measurement data this will also be stored in the EEPROM. Loading a new test configuration also deletes the previous bounds data.
The user cannot directly access or modify the EEPROM stored data, this is handled transparently by the system. The user can however issue an instruction to invalidate the EEPROM contents, this has the same effect as a factory reset.
The configuration and bounds data stored on the EEPROM can be written back to an SD card. This function is used to duplicate the measurement setup on multiple devices
Pass Fail DataBounds type pass fail data is stored in the EEPROM as a set of frequency point and Y axis value pairs. This data cannot be modified directly by the user once set. The bounds data can however be invalidated and subsequently set by measurement or loading from SD card.If, during boot, bounds data is found in the EEPROM, this data shall be used for the measurement bounds pass fail checking. Therefore any changes made to bounds data on an SD card will have no effect.
Output Voltage stepsThe output voltage calibration for each amplifier gain step is stored in the EEPROM. Should the EEPROM be invalidated output voltage steps will default to approximate values. When rebooting from a factory reset the system automatically executes a self calibration process and stores the voltage steps to EEPROM.
AMS ANC Chip
ZUMI impements a code module specifically for interfacing with AMS AS34XX ANC chips. The interface is through the I2C bus on the rear panel.
ZUMI board has built in 4.7k Ohm pull-up resistors on the I2C bus Clock and Data lines. This I2C bus clocks at 400kHz by default.
Parameter __________________ ValuePull-up Voltage ______________ 3.3VPull-up Resistor ______________ 4.7kOhmI2C Clock Speed _____________ 400kHz
When the DUT PCB uses the AMS chip Clock and Data lines for alternative functions (i.e. Standby, Mode etc.). The designer must take into account that these lines are also used for I2C communication.
Instructions to communicate with the AMS chip, to set registers or perform other functions, are defined in the test configuration file with the ACTION key followed by the first argument “ams”e.g.action = ams,setregs,0x30,0x1,0x31,0x1action = ams,autogain,ANCLeft,0x30,ANCRight,0x31
the second argument specifies the type of action to peform and subsequent arguments are specific to the action.
The following actions are available

The ams action is defined as a PRE action by default. This means the action is executed before the measurement data is acquired. The autogain gains actions (FF and FB) are forced to be post actions. In general the user does not need to specify a PRE / POST flag for AMS actions.
When the system attempts to perform an action but an AMS device cannot be found on the bus (either device address 0x46 or 0x47), the system will keep retrying at approximately 0.5 second intervals. The retry state is indefinite. This retrying state can be terminated by pressing the start/stop button.
For autogain adjustment the system the user defines a limit to the number of attempts in the configuration using the key “repeat” e.g.;repeat = 5Should the limit be reached before the ANC criteria has been satisfied the system will proceed with the measurement sequence but a failed result will be returned.
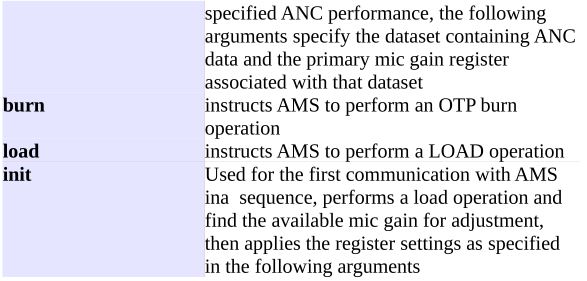
In order to BURN the AMS chip OTP settings the the system will first determine if all test criteria have passed. If so at the completion of the testing sequence the BURN instruction will be issued. If the DUT failed any criteria (including those not specific to ANC) the BURN instruction will not be issued. This allows for product rework while preserving the chip OTP registers.
The system will issue a burn instruction automatically if the autoburn flag has been set and the above conditions are met.
The burn flag is set by the value for the ams related keys. The value must have a first argument with the string “autoburn”e.g.prestart = ams,init,autoburn,0x30,0x81,0x31,0x81…
Log Data
Two kinds of log files can be generated, a summary information log and log of the complete measured data.
The summary information log records summary information for each measurement run such as time of test, measured data metrics, result of each test item, overall results etc.
Complete measured data logging stores all the curve data for all visible datasets. Note that datasets that are not associated with a datasetgroup will not be logged. The data size can become very large, it is recommended to only enable this logging if it is specifically needed.
The summary information logging is active by default. Complete data logging is enabled ordisabled in the menu;Settings – Logging – Log All Dataor by serial command;Log All Data,1; ( ,1 for enable ,0 for disable)
Data is logged to SD card and/or emitted as a string over the serial interface. The logging for SDcard and serial interface is enabled or disabled in the menu;Settings – Logging – SD Card Data LoggingSettings – Logging – Serial Data Loggingor by serial command;SDCard Data Logging,1; ( ,1 for enable ,0 for disable)Serial Data Logging,1; ( ,1 for enable ,0 for disable)
Please note for large amounts of data points logging can be slow, especially transmitting over the serial interface. It is recommended that spectral data be remapped to <= 300 points for logging.This greatly reduces the time to write the log files and avoids huge file sizes.
In the factory reset state all data logging is disabled.
If the measurement is running in run continuous mode all data logging is disabled.
Summary Information Log Format
The summary information log is strutured as an ini file.The first section is labeled “START” and the last section is labeled “FINISH”All other sections are labelled with the name of the test item. The is presented as key value pairs and is specific to the type of test being executed.
[START]start_datetime = 20190330115833[0]Name = FreqRespbounds = FRF1,PASSEDbounds = FRF2,PASSED[FINISH]overall_result = PASSEDelapsed_time_s = 1
INI file Configuration
The ZUMI test profile can be completely configured by loading a *.ini file from SD card.
The ZUMI configurations ini files follow the common for format for Windows ini files wher the ini file is structured and section – key – value.
The section defines a test item. The section is taken as a string name. The name is used only for user reference in the ini file.
e.g.[Test 1]…[Test 2]or[Passive Response]…[Active Response]…[Distortion Test]etc.
Key – Value Descriptions
OutputMute
Output mute set one or both output channels to a mute state.The value supplied is ‘left’ and/or ‘right’OutputMute = Left // This will mute the left output channel onlyOutputMute = Right // This will mute the right channel onlyOutputMute = Left, Right // This will mute both left and right channels, the key words may be given in any orderOutputMute = None //This will enable both Left and Right output channelsIf the OutputMute key is not given and the acquistion is linked the Mute state from the linked aquisition will be usedIf the OutputMute key is not given and the aquisition is not linked both output channels will be enabled
acqname
acqname (acquisition name) assigns a reference name for the acquisition setup.
The first occurance of an acquisition name sets the test item as the source of acquisition settings.Subsequent references to this acquisition name forces the associated test item to use the same settings as the first occurance of the name.
The acqname can be any string and is used only for reference.[test item 1]acqname = test item setup…[test item 2]acqname = test item setup
in this example test item 2 will reused all settings from test item 1.
The settings for output voltage, outputchannel and output mute can be overriden if specified.
Reference Data
Each graph may contain an additional dataset called reference data.The reference data curve is displayed on the graph along with the measured data and is normally used for comparing the measured data to the reference data.Reference data is only stored on the SD card. If there is no SD card inserted reference data cannot be loaded or created.

Display of the reference data is controlled through the menuSettings – Reference Data – Display Reference Curvesor serial commandDisplay, Reference Data, [1 or 0]
Reference data is stored in txt files in the test profile folder;

Each graph can have a reference data file. The files must be named with the graph name (this is the same as the dataset group name) then an underscore and the word REFERENCE.TXTi.e.[datasetgroup_name]_REFERENCE.txt
The reference data txt file should contain 2 or 3 colums of data being x-axis , y-axis(, yb-axis).The data is assumed to be of the type of the datasetgroup named.
Rules for text data files;All leading and trailing whitespace is ignoredAny line not beginning with a number is ignoredThe first line beginning with a number is used to define the number of columnsAll subsequent lines will be read only to number of columns as the first line, any extra columns are ignored.The delimiters between numbers are [space] ; , \t \r \nLines end with \nThe first column (usually always frequency points) must increase monotonicallyThe maximum number of rows allowed is 2048.
The user can create the reference data files through the menu;Settings – Reference Data – Set current data as referenceor serial command;Set ReferenceThis command takes the current displayed data on each graph and generates a reference dataset.The reference will be the average of all displayed datasets.
When the system is booted, or a profile is loaded reference data will be loaded from the profile folder if it exists.The user can instruct the system to load reference data from the SD card at anytime through the menu with;Settings – Reference Data – Load Reference Dataor serial command;Load Reference
Test Profiles
All processes on ZUMI instruments are driven by a test profile. The test profiles describes all measurement settings, acquisition, calculations, pass fail criteria and actions to be executed.
A test profile is structured as a *.ini text file with sections, keys and values.
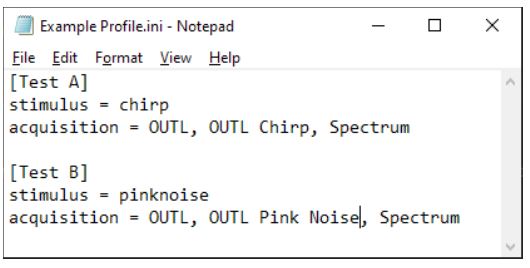
The example profile above shows a very simple setup with two test items, Test A and Test B. Test A will output a chirp type stimulus and acquire the signal from OUTL. Test B will output a pink noise signal and acquire data also from OUTL. In both case the resulting data will be displayed on a graph called ‘Spectrum’. Note there are several additional parameters required to for a measurement, when absent from an *.ini default values are set.
SD Card Files and Folders
The ‘current’ test profile is stored in internal memory and is loaded on system boot. This includes bounds type pass/fail data.
The test profile is identified by its string name. The current profile name is shown in the top middle of the display
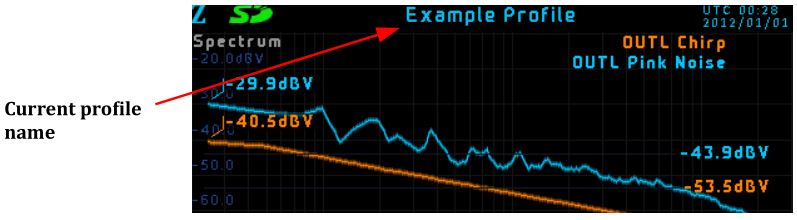
A different profile can be loaded at any time from the menu by entering ‘Select Profile’, highlighting the desired profile name and pressing enter.
When a different profile is loaded all existing information on the internal memory is replaced by the newly loaded profile.
The ‘Select Profile’ menu will display all *.ini files found on an SD card (if inserted) and the factory preset profiles available.
When ZUMI instruments are operated without an SD card only the factory preset profiles will be available and changing profile will cause all previous settings to be lost.
When an SD card is inserted, or when the system is booted the SD card will be scanned for the presence of a profile folder and associated sub folders.
The folder structure is a followsX:\ denotes the root directory of the SD card and the drive letter ‘X’ will vary[PROFILE] is the string name of the profile.
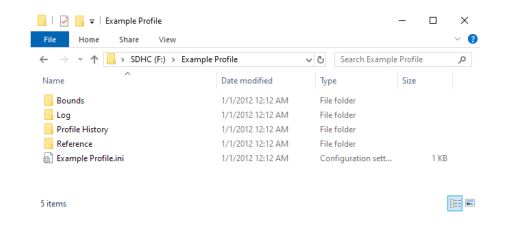
X:\[PROFILE]X:\[PROFILE]\LogX:\[PROFILE]\ReferenceX:\[PROFILE]\Profile HistoryX:\[PROFILE]\ReferenceX:\[PROFILE]\Bounds
If any of the folders do not exist they will be created
The profile *.ini file isX:\[PROFILE]\[PROFILE].iniif the file does not exist the ‘current’ profile stored in internal memory is written to the SD cardIf the file exists no change is made to this fileWhen a profile is loaded from SD, this is the file that is used. Please Note it is quite possible for the profile stored in internal memory and the profile of the same name held on the SD card to be completely different.
A time stamped profile INI file is also stored in the Profile History directory. The filename follows the formula;
E:\[PROFILE_NAME]]\Profile Hisotry\[PROFILE_NAME]_[TIME_STAMP].iniIf the file does not exist the ‘current’ profile is written with the current time stampIf the file does exist no change is made to the file.Any time a changed is made to the test profile a timestamp is generated and the new profile is stored on the SD with this time stamp appended.
Bounds FilesE:\[PROFILE_NAME]]\Bounds\[DATASETGROUP_NAME]_UPPERBOUND.txt
E:\[PROFILE_NAME]]\Bounds\[DATASETGROUP_NAME]_LOWERBOUND.txtIf the files do not exist and the internal memory is holding bounds data, these files will be written to this folder.If the files already exist no changed is made.
Time stamped Bounds Files are also used. These handled in the same fashion as time stamped profile files.E:\[PROFILE_NAME]]\Profile Hisotry\[DATASETGROUP_NAME]_UPPERBOUND_[TIME_STAMP].txtE:\[PROFILE_NAME]]\Profile Hisotry\[DATASETGROUP_NAME]_LOWERBOUND_[TIME_STAMP].txtIf the file does not exist the time stamped bounds data will be written to this folder.
The principal is that if the SD card already has ini files or bounds files in the profile folder these will not be modified automatically, However the profile history folder will hold a copy of the profile and bounds stored in internally memory
The user can choose to write the current profile to SD card in which case the ini file and bounds will be overwritten.The user may also choose to load the profile (through select profile) in which case the internal memory will be overwritten
If the user modifies bounds data or profile ini files on the SD card these will not automatically update the internal memory. The user must specifically instruct the system to load those files.
*.ini profile files located in the root directory are treated as ‘template’ profiles. Upon loading an ini file from this location the above logic will be followed, that is to say if the a profile folder does not exist it is created and populated with the newly loaded profile. If however it already exists no changes are made to the existing data on the SD card, but the newly loaded profile will be written to the profile history (the time stamp will necessarily be different).
No check is made to determine if the profile history ini and the profile ini are the same.
If an ini file is located in a folder in the root directory and does not have the same name as the folder, it will automatically be renamed to the folder name. The purpose of this is a user may load a template profile, thereby creating a folder structure for that profile. Subsequently the user could put the SD card into a PC and rename the folder to effectively create a project specific profile. For example, the user loads the template ‘Headphone Test’. Then renames to the folder to ‘Headphone Model X’. The system will automatically rename the ini file as Headphone Model X and display it in the ‘Select Profile’ menu.
If a template profile (i.e. an *.ini in the root directory of the SD card) is loaded and the profile folder with the same name exists.
Machine ID
The machine ID is a unique identifier for the ZUMI instrument.By default the machine ID is assigned ZUMI plus the last 6 characters of the bluetooth MAC address.The user may specifiy any character string of up to 15 characters as the machine ID, using the serial command ‘SET MACHINE ID” following by the character string. The machine ID may be set to a NULL string.The assigned machine ID is stored in internal memory.A factory reset will delete the stored machine ID.The machine ID is used as a component in the file name of log files and as the Bluetooth ‘Name’.If the Machine ID is changed the system will also change the Bluetooth name to match.
Correction Data
Correction data may be applied to each input signal. The correction data is normally used to compensate for the response characteristic of an attached sensor such as a microphone. Correction data is effectively a frequency response function that modifies the spectrum data from an input channel measurement.
Correction data takes the form of a set of frequency, magnitude and phase points. Each measurement has this correction applied to the spectrum data before any computation is done.Note the correction is not applied to the time domain data , so for example the signal RMS values is not changed by correction data.
Correction data is stored internally in EEPROM and always applied to input channel spectral data.The correction data is not specific to a test configuration and so the same correction data is used for all test configurations. There is no option to disable the correction.
Correction data is uploaded from an SD card with the command ‘AFE LOAD CORRECTION DATA’
The correction data files must be located in a folder named ‘CorrectionData’
Each input channel shall have a *.txt file with data points, the file is named [input channel name]_Correction.txt
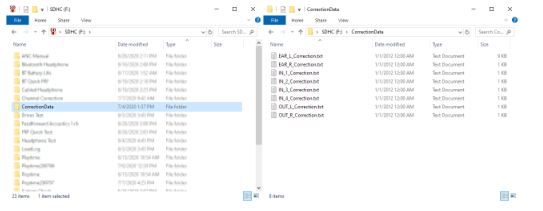

The simpliest method to get the folder and file names correct is to insert an SD and send the command ‘AFE SAVE CORRECTION DATA’, this command will create the folder and text files. The user can then simply edit the correction files as required and execute the ‘AFE LOAD CORRECTION DATA’ command.
The correction data files shall contain frequency, magnitude and phase data points in columns. The frequency points are arbitrary but there must be at least 2 points. The maximum number of points is 1024, any data beyond this number of points is truncated. Any line beginning with a numerical digit is interpretted as a row of data, all other lines are ignored. The column points can be delimited with a space, comma or tab.
The user may freely add text information or notes, just make sure the line does not start with a digit.
If an AFE LOAD CORRECTION DATA command is given, and the CorrectionData folder does not contain a file for a given input channel, that input channel is left unchanged. That is any existing correction data is kept unalterated. Therefore is the user wishes to modify only one input channel correctoin data, only this file should be present in the folder when teh instruction is given.
The AFE SAVE CORRECTION DATA command extracts the correction data currently stored in EEPROM and write its to the SD. This command will over-write and existing files and cannot be reversed.
The correction data in the EEPROM can be removed with the command AFE DELETE CORRECTION DATA. This command will delete all corretion data from the EEPROM. Subsequent to this command all correction data is lost and not correction is applied to spectral data.
ZUMI Measurement Instruments Manual – ZUMI Measurement Instruments Manual –
[xyz-ips snippet=”download-snippet”]